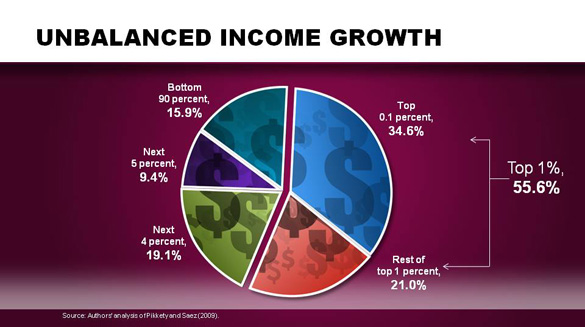
Unequal Income Growth, 1979-2009
Updated data from the Economic Policy Institute trace the pattern of income growth between 1979 and 2009. As the graph below shows, 34.6% of all income growth over the past three decades has gone to the top one-tenth of 1% of all earners (some 13,000 families). The bottom 90% of all earners, meanwhile , has collectively seen only 15.9% of all income growth over the same period.


 Email Sign-Up
 RSS Feed