North Carolina’s Labor Market: 2010 Review
North Carolina’s labor market ended 2010 little changed from the start of the year. Between December 2009 and November 2010, the most recent month for which data are available, payroll employment in North Carolina rose by just 1,400 positions (+0.04 percent). While the number of unemployed Tar Heels and the the statewide unemployment rate fell during the year, much of the decline was due to a troubling contraction in the size of the state’s labor force. And, little evidence suggests that a robust jobs recovery will take hold in early 2011.
One Year, Two Job Markets
North Carolina’s labor market underwent two distinct phases in 2010 (figure, below). The first half of the year was a time of weak but positive growth. Between January and June, net job growth averaged 6,500 positions per month. 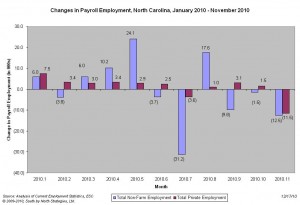 Total employment increased at a rate of 0.2 percent per month, while the number of unemployed individuals fell at a monthly rate of 1.5 percent. The labor force also grew at a monthly rate of 0.03 percent. The statewide unemployment rate, meanwhile, fell to 10 percent from 11.1 percent.
Much of that progress was the by-product of public policy supports provided by the federal government through the American Recovery and Reinvestment Act and related initiatives like the homebuyer tax credit and temporary hiring for the 2010 Census. As those supports faded away during the second half of 2010, North Carolina’s labor market sputtered.
Between July and November, net job loss in the state averaged 7,500 positions per month. Total employment fell at a rate of 0.2 percent per month, while the number of unemployed individuals fell at a monthly pace of 0.4 percent. Yet the labor force also contracted at a a monthly rate of 0.2 percent. The statewide unemployment rate, meanwhile, stagnated at a level fluctuating between 9.6 and 9.8 percent.
Year Fails to Alter Basic Jobs Story
Despite being some 18 months into an national recovery, North Carolina has yet to regain the jobs lost during the national recession that spanned December 2007 to June 2009. Since December 2007, North Carolina has lost, on net, 281,800 positions or 6.8 percent of its payroll base. Since bottoming out in September 2009, the state’s labor market has gained just 15,300 payroll positions (+0.4 percent).
The meager job growth recorded in 2010 was insufficient to close the jobs gap. The state netted just 1,400 jobs over the year. A net gain of 5,700 private-sector payroll positions was offset by a loss of 4,300 public-sector ones. The decline in the public sector was driven by payroll reductions among local governments.
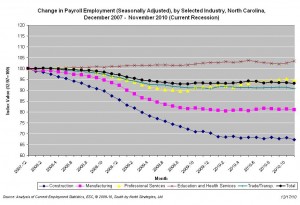 As the figure (left) shows, major private industries recorded little payroll employment growth in 2010. Education and health services grew the most in absolute and relative terms (+15,300, +7 percent). The next largest gainer in absolute terms was professional and business services (+15,000, +3.2 percent).
Construction, meanwhile, shed the most positions in absolute and relative terms (-7,700, -4.3 percent), followed by leisure and hospitality services (-5,800, -1.5 percent). All other major private industry groups posted no or slight changes.
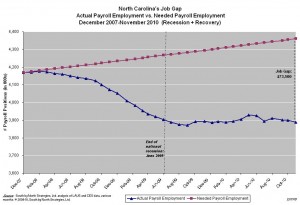 Unfortunately, North Carolina needs to add some 5,500 positions each month to keep pace with workforce growth. If one considers the jobs that should have been created since 2007 but were not, the job gap facing the state is 473,500 positions (figure, right).
Joblessness Remains Widespread
Weak job growth in 2010 did little to reduce the problem of joblessness. The monthly number of unemployed North Carolinians averaged 465,474. And, while the statewide unemployment rate dropped sharply during the first half of the year, it remained stuck between 9.6 and 9.8 percent during the year’s second half.
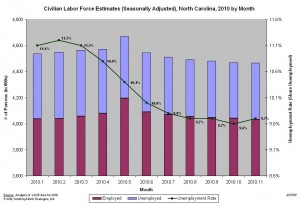 Unfortunately, the drop in the unemployment rate, especially during the second half of the year, is attributable largely to a drop in the size of the labor force. Individuals unable to find work have responded by giving up. As the figure (left) suggests, the state’s labor force shrank by 71,715 people (1.6 percent) in 2010. Over the year, the share of the adult non-institutional civilian population in the labor force fell to 61.5 percent from 63.2 percent.
The drop in the size of the labor force suggests that joblessness is more widespread than reflected in official statistics. It also is alarming given the overall growth in the number of working-age North Carolinians. While the size of that population grew by 1.1 percent over the year (up 4.5 percent since December 2007), the size of the state’s labor force is no bigger now than it was in July 2006.
The pattern of falling unemployment rates coupled with a shrinking labor force has occurred throughout the state. In October 2010, the most recent month for which full data are available, unemployment rates were lower in 95 counties and 14 metropolitan areas than one year prior. Yet labor forces were smaller in 78 counties and 11 metros. The patterns were more pronounced in non-metropolitan areas than in metropolitan ones.
As of October 2010, some 9.9 percent of the non-metropolitan labor force was unemployed compared to 8.8 percent of the metro one. Over the year, the size of the non-metro labor force declined by 4.7 percent compared to a 0.2 percent drop in the metro labor force. (Note: this paragraph revised on 1/3/11 to reflect updated data.)
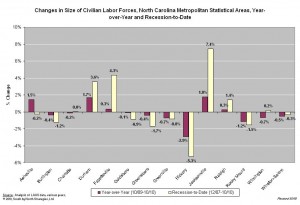 The figure to the right shows changes in the size of the labor force for each of North Carolina’s 14 metro areas over two periods: October 2009 to October 2010 and December 2007 to October 2010. The only metros to record positive growth rates over both periods were the military communities of Jacksonville and Fayetteville, along with Durham and Raleigh. Hickory’s labor force contracted at the greatest rate over both periods. (Note: the paragraph and graph revised on 1/3/11 to reflect updated data.)
Considerations for 2011
North Carolina’s labor market ended 2010 in a sickly condition. From a labor market perspective, the most recent recession has been the deepest, longest one of the postwar era. In fact, the 11.2 percent statewide unemployment rate posted in February 2010 was the highest monthly rate recorded since the 1976 advent of modern record keeping.
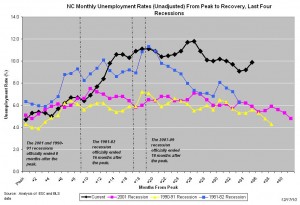 By the same point in time following the prior three North Carolina recessions (35 months after the business cycle peak), the statewide unemployment rate was falling and was at or near the level seen at the start of the downturn (graph, left). This has yet to happen. Assuming current trends hold, the ongoing recovery period soon will overtake the 2001 recovery period as the longest since 1980.
In the near term, the prospects for growth remain weak. Demand remains muted and likely will become further depressed in the wake of state and local budget cuts that probably will occur later in the year. Moreover, many employers have idle capacity that could accommodate any increases in demand without additional investment or hiring. For such reasons, numerous forecasters (see here and here and here) are predicting little job growth for North Carolina in 2011. In fact, the projected level of job growth is below the level needed to accommodate the natural growth in the size of the workforce, to say nothing of individuals who may re-enter the workforce in 2011. Furthermore, an influx of returning workers could push up the statewide unemployment rate.
A lack of job growth likely will be the most serious problem facing North Carolina in early 2011. A scarcity of openings means that many jobless individuals are unable to find positions at all or find positions that provide the desired number of hours. Moreover, increasing durations of unemployment (the national average duration in November 2010 was 33.8 weeks) raise the odds that the long-term unemployed will become effectively unemployable due to skills deterioration, stiff competition, and negative stereotyping. Similarly, a lack of openings makes it harder for young workers and skilled graduates of college and training programs to find jobs. Left unchecked, a serious cyclical employment problem is at risk of becoming an intractable structural one.
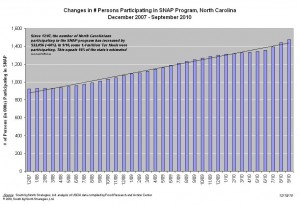 Perhaps the most troubling indicator of the economic hardships facing North Carolina’s households is the explosion in the size of the state’s Food Stamp caseload. Between December 2009 and September 2010, the most recent month for which data are available, the number of North Carolinians participating in the program grew by 13.3 percent. Much of the growth is attributable to job losses among individuals with modest incomes — job losses that pushed their households below the income-eligibility level. Moreover, since December 2007, the number of Tar Heels participating in the program has grown by 59.9 percent (graph, above). As of September 2010, some 16 percent of the state’s population was participating in the program.
The Year Ahead
Three years after the onset of a severe national recession and 18 months after the start of a feeble recovery, North Carolina’s labor market finds itself remains in terrible shape. Economic growth simply is not occurring at a pace needed to accommodate all those ready, willing, and able to work. Moreover, weak demand reduces the odds that the private sector will generate needed growth, while the withdrawal of public policy supports is offsetting what private-sector growth is occurring.
Early 2011 is apt to be a time of slow growth, high levels of joblessness, and mounting household hardships, even in regions faring better than the state as whole, such as the Research Triangle. Such problems will be especially acute for people and places coping with long-term unemployment.


 Email Sign-Up
 RSS Feed