16.02.2012
Policy Points
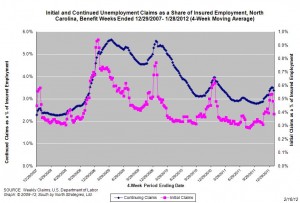
For the benefit week ending on January 28, 2012, some 13,562 North Carolinians filed initial claims for state unemployment insurance benefits, and 124,781 individuals applied for state-funded continuing benefits. Compared to the prior week, there were fewer initial and continuing claims. These figures come from data released by the U.S. Department of Labor.
Averaging new and continuing claims over a four-week period — a process that helps adjust for seasonal fluctuations and better illustrates trends — shows that an average of 14,483 initial claims were filed over the previous four weeks, along with an average of 126,586 continuing claims. Compared to the previous four-week period, the average number of initial claims was lower, as was the average number of continuing claims.
One year ago, the four-week average for initial claims stood at 17,862, and the four-week average of continuing claims equaled 141,030.
In recent weeks covered employment has increased and now slightly exceeds the level recorded a year ago (3.74 million versus 3.71 million). Nevertheless, there are still fewer covered workers than there were in January 2008, which means that payrolls are smaller today than they were four years ago.

The graph shows the changes in unemployment insurance claims measured as a share of covered employment in North Carolina since the recession’s start in December 2007.
Both new and continuing claims appear to have peaked for this cycle, and the four-week averages of new and continuing claims have fallen considerably. Yet continuing claims remain at an elevated level, which suggests that unemployed individuals are finding it difficult to find new positions.
14.02.2012
Policy Points
Economic policy reports, blog postings, and media stories of interest:
14.02.2012
Policy Points
Jack Temple of Policy Shop mulls the “spatial mismatch” theory of unemployment and finds it wanting.
While the spatial mismatch theory was actually introduced in the 1960s to explain the role that residential segregation plays in fueling unemployment for black households, it’s gotten renewed attention as of late given the role that the housing downturn has played in the recession. The story goes like this: 1) Some 16 million households have negative equity in their homes, 2) these households are likely clustered in areas that are suffering from a more general economic downturn, 3) having an underwater mortgage makes it difficult for people to move to areas with stronger job growth, and 4) mismatch ensues.
…
Sounds logical — but, according to a report released on Wednesday from the Federal Reserve Bank of Boston, the spatial mismatch theory just doesn’t shake out. The Fed report modeled the role that negative equity itself plays in household migration decisions and then estimated the impact of improved mobility for underwater households on the national unemployment rate.
…
The results are pretty clear. Overall, negative equity reduced inter-state relocation (the type of relocation most like to occur for employment purposes) by a grand total of 0.05 percent from 2006 to 2009…. If this reduction hadn’t occured, and all of these people not only moved but also found a job in their new location, it would have yielded an unemployment rate in 2009 of 9.0 percent as opposed to 9.3 percent.
14.02.2012
Policy Points
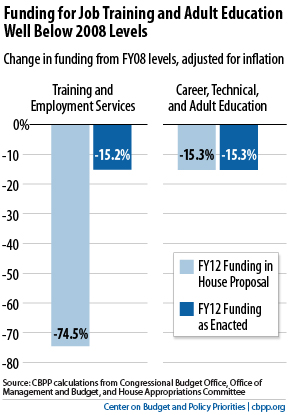
Off the Charts points out that sustained disinvestment has undercut the ability of education and training programs to assist displaced workers.
If policymakers really want to improve outcomes for less-educated, lower-skilled workers, they need to invest more in job training and adult education programs to make them more available and effective. Unfortunately, they’ve done the opposite. House Republicans have backed the large cuts that Congress has made in federal funding for job training and adult education in recent years and have pushed for even bigger cuts.
A chart included in the post only reinforces that point.

13.02.2012
Policy Points
Economic policy reports, blog postings, and media stories of interest:


 Email Sign-Up
 RSS Feed