30.06.2011
Policy Points
For the benefit week ending on June 11th, 12,340 North Carolinians filed initial claims for state unemployment insurance benefits, and 107,944 individuals applied for state-funded continuing benefits. Compared to the prior week, there were more initial and fewer continuing claims. These figures come from data released by the U.S. Department of Labor.
Averaging new and continuing claims over a four-week period — a process that helps adjust for seasonal fluctuations and better illustrates trends — shows that an average of 11,674 initial claims were filed over the previous four weeks, along with an average of 108,135 continuing claims. Compared to the previous four-week period, the averages of initial and continuing claims were essentially unchanged.
One year ago, the four-week average for initial claims stood at 12,903 and the four-week average of continuing claims equaled 158,317.
While the number of claims has dropped over the past year so has covered employment. Last week, covered employment totaled 3.7 million, down from 3.8 million a year ago.
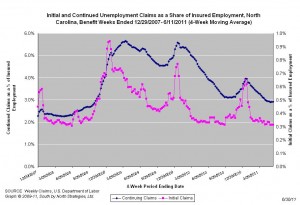
 The graph (right) shows the changes in unemployment insurance claims (as a share of covered employment) in North Carolina since the recession’s start in December 2007.
Both new and continuing claims appear to have peaked for this cycle, and the four-week averages of new and continuing claims have fallen considerably. Yet continuing claims remain at an elevated level, which suggests that unemployed individuals are finding it difficult to find new positions.
30.06.2011
Policy Points
Writing in The American Prospect, Louis Uchitelle asks if it is too late to reinvigorate domestic manufacturing.
One problem is clout. As manufacturing’s presence shrinks, so does its influence. Not that the nation’s manufacturers are milquetoasts when it comes to lobbying, but the voices from the growing financial and service sectors are louder, and globalization continues to be the flavor of the day. “If anything, business schools are teaching their students the importance of offshoring,” says Yoshi Tsurumi, a professor at the Zicklin School of Business, Baruch College, City University of New York.
…
Even labor has a diminished stake in defending manufacturing, since the portion of the workforce employed in the sector has shrunk to 10 percent today from 26 percent in 1960 and 13 percent as recently as 2000.
…
That decline can be reversed, but the will to do so — the laser-like focus on making things in America — may no longer exist or may be too compromised to be easily revived. The most powerful lobbyist on behalf of manufacturing is the National Association of Manufacturers. But its members include multinationals like Dow Chemical and Caterpillar with factory networks across the globe, thus dividing their loyalties. Even the NAM’s numerous small members aren’t as rooted in America as they once were, which helps to explain the NAM’s support of free-trade agreements that suppress barriers to the movement of goods across borders.
29.06.2011
Policy Points
Economic policy reports, blog postings, and media stories of interest:
29.06.2011
Policy Points
Economist’s View explains the evidence suggesting that structural unemployment is not the main problem facing the labor market.
The point is that when we talk about structural unemployment, we assume aggregate demand is not the problem. Thus, structural unemployment must be measured under an assumption that demand is sufficient to return us to full employment. Structural unemployment is driven by changes in tastes, technology, etc. that produce geographic, skill, or other mismatches that prevent reemployment. For example, if there is a change in tastes that causes the demand for hula hoops to fall and the demand for skateboards to increase, or a change in technology that causes the demand for typewriters to fall and the demand for word processing software to increase, then we have to move workers and other resources out of hula hoop and typewriter production and into the skateboard and word processing businesses. That will take time if there are geographic, training, or other barriers that prevent the quick translation of resources from one use or one place to another. Note, however, that the problem is not lack of demand. People want more skateboards and word processors than they currently have, so that unlike the example above where higher demand and the higher wages that come with it cause the worker to move and eliminate the mismatch, an increase in demand won’t fix the problem. If an increase in demand will fix the problem, as in the example above, then it’s not a structural problem.
29.06.2011
Policy Points
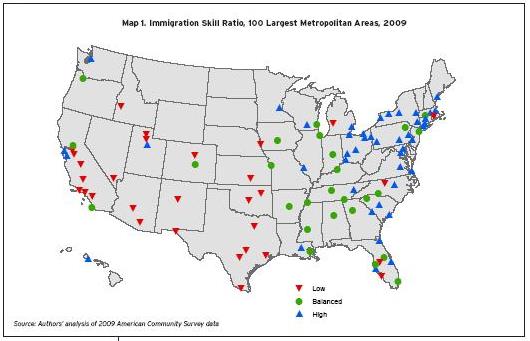
A recent paper from The Brookings Institution analyzed the distribution of high-skill and low-skill immigrants across America’s 100 largest metropolitan areas.
Interestingly, the three North Carolina metros included in the list (Raleigh-Cary, Charlotte-Gastonia, and Greensboro-High Point) displayed different patterns. Raleigh-Cary was a destination for highly skilled immigrants, while Greensboro-High Point was a destination for immigrants with low skills. Charlotte, meanwhile, attracted immigrants from both groups equally.

 The graph (right) shows the changes in unemployment insurance claims (as a share of covered employment) in North Carolina since the recession’s start in December 2007.

 Email Sign-Up
 RSS Feed