
Few Changes Along The Local Jobs Front
CHAPEL HILL (March 18, 2011) – Eighty-six of North Carolina’s 100 counties and 12 of the state’s 14 metro areas had labor forces in January 2011 that were smaller in size than they were one year before. Moreover, 77 counties and 8 metros posted double-digit unemployment rates in January. These findings come from estimates released today by the Employment Security Commission.
“January delivered little in the way of meaningful job growth in communities across North Carolina,” says John Quinterno, a principal with South by North Strategies, Ltd., a research firm specializing in economic and social policy. “Job growth was meager, and the lack of growth continued to push unemployed individuals out of the labor market.”
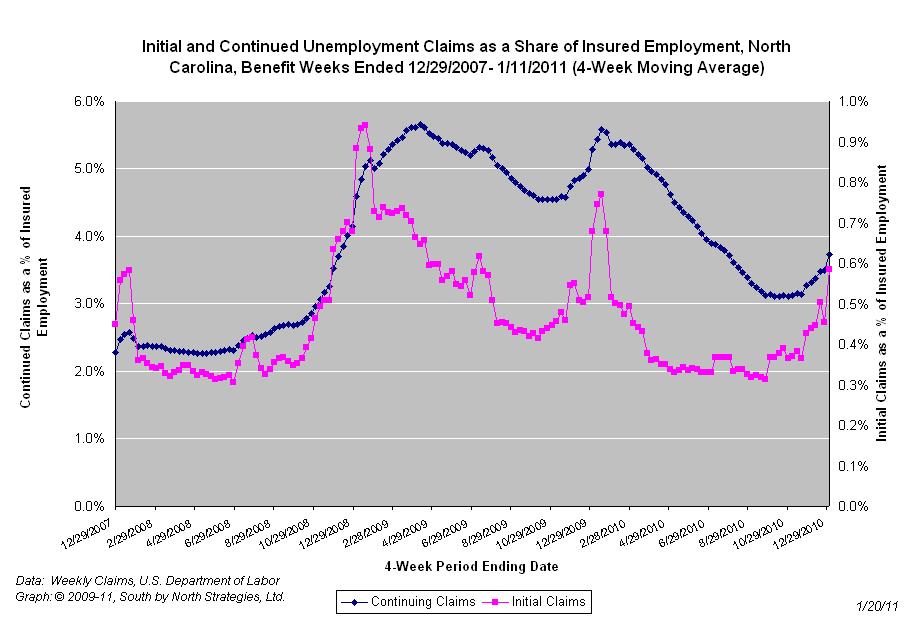
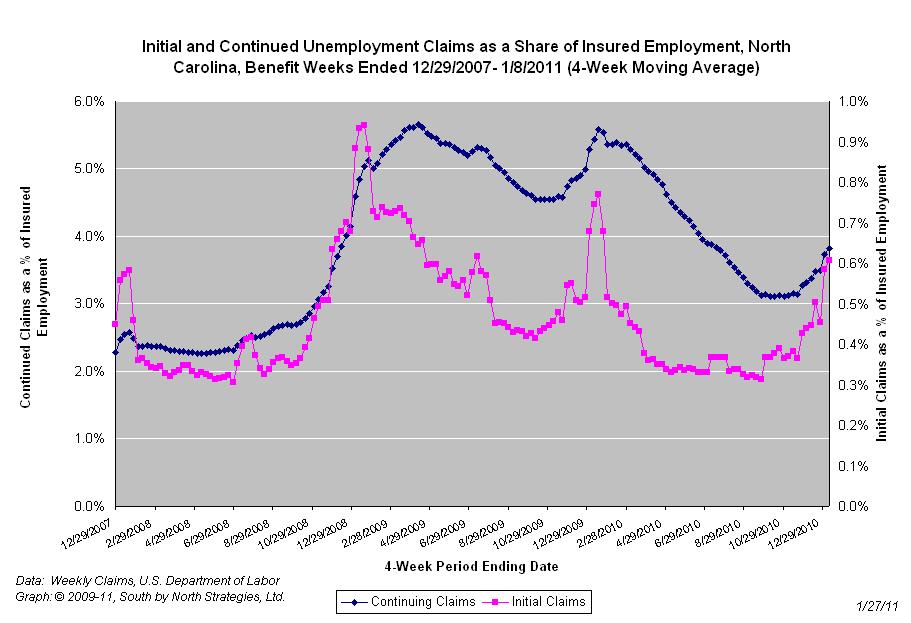
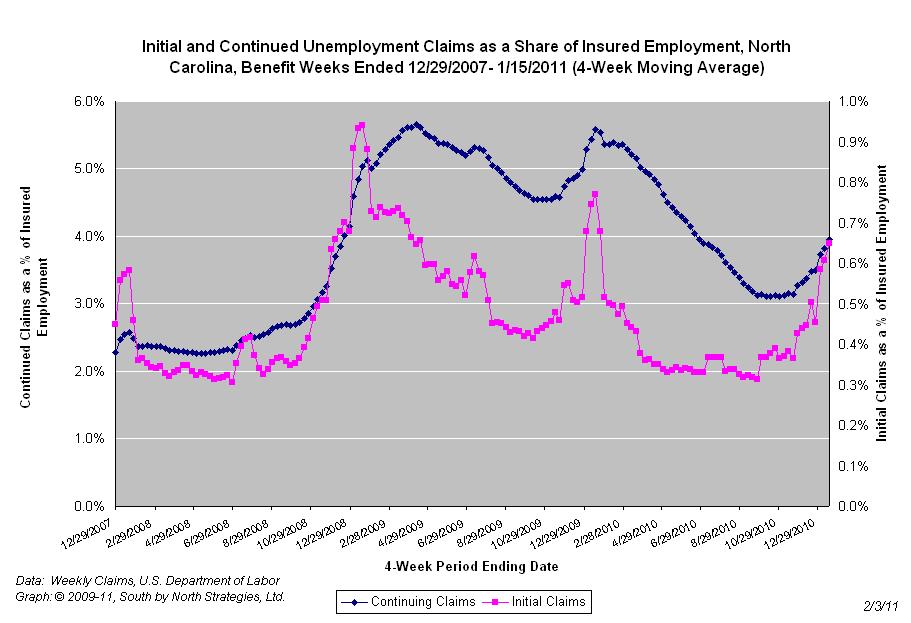
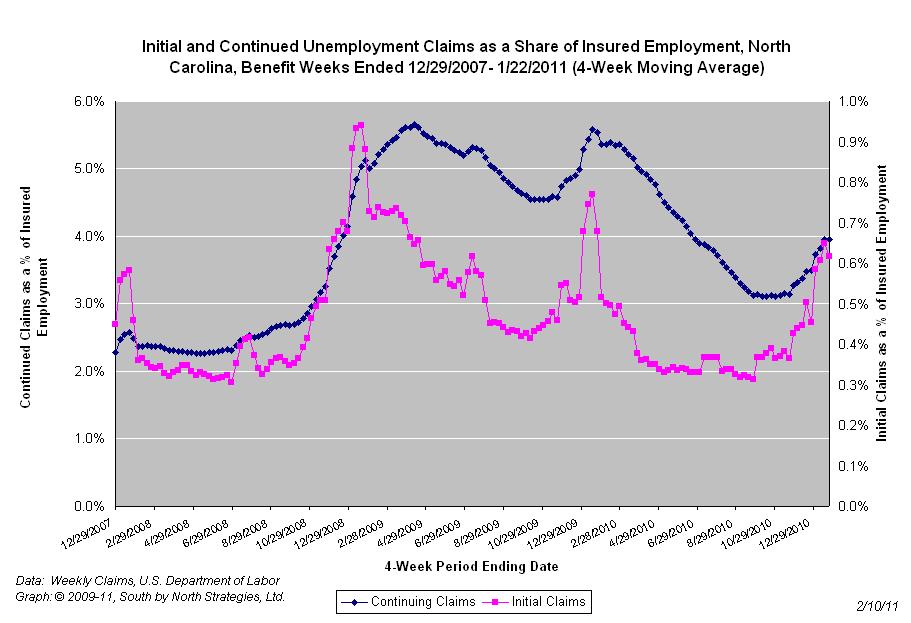
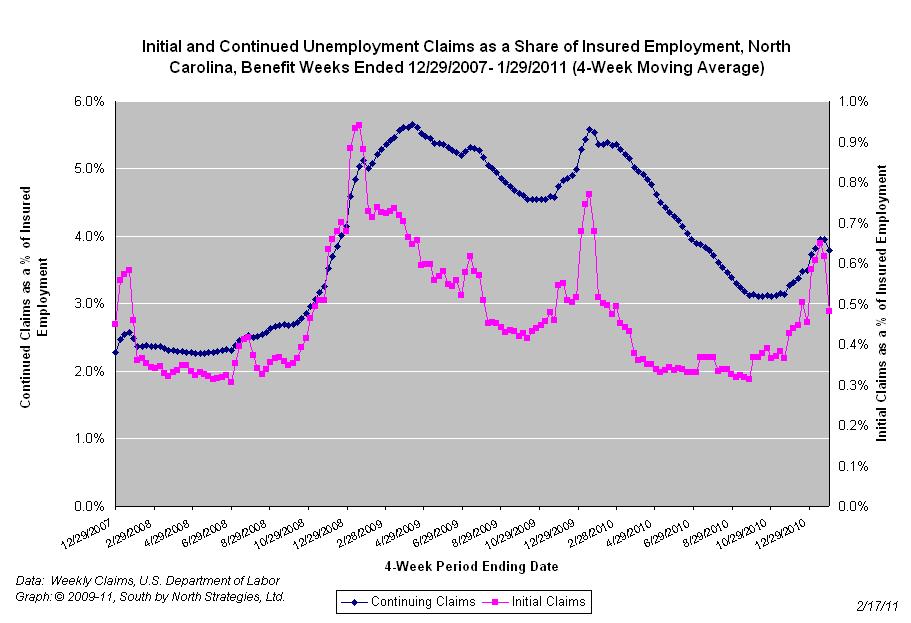
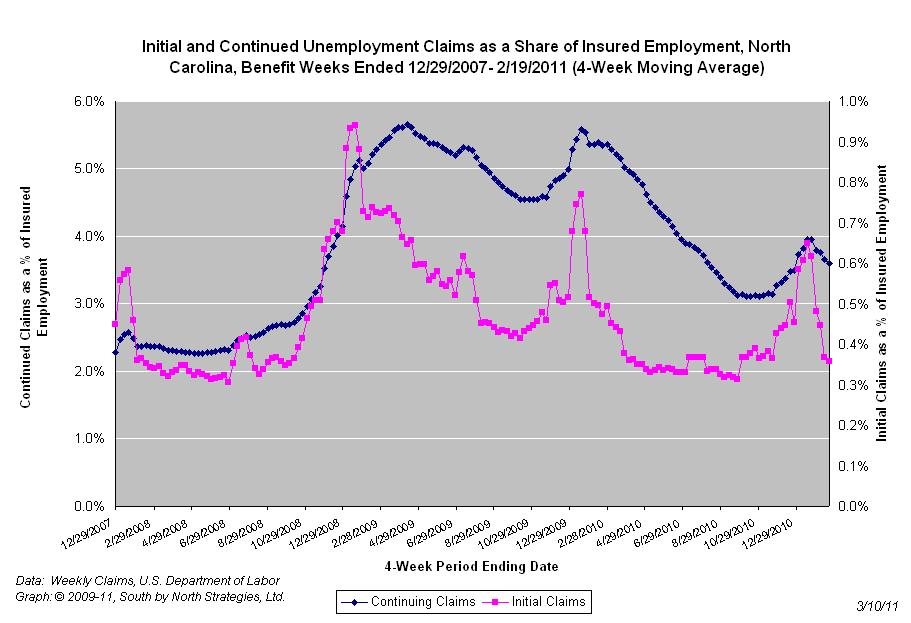
Since the economy fell into recession in December 2007, North Carolina has shed 7.4 percent of its payroll employment base (-310,400 positions) and has seen its unadjusted unemployment rate climb from 4.7 percent to the current level of 10.5 percent. In January, the state gained 4,500 more payroll jobs than it lost.
Every region of the state experienced weak labor markets in January. Unemployment rates were at or above 10 percent in 77 counties; over the past year, however, there was a drop in the number of counties posting double-digit unemployment rates. Individual county rates in January ranged from 6.5 percent in Orange County to 19.4 percent in Graham County.
“Labor markets in non-metropolitan communities remain especially weak,” adds Quinterno. “Last month, 11.7 percent of the non-metro labor force was unemployed, compared to 9.9 percent of the metro labor force. More alarmingly, the non-metropolitan labor force continued to shrink. Since December 2007, the non-metropolitan labor force has declined by 4.4 percent or 59,016 individuals. Many of those missing persons are effectively jobless.”
Last month, unemployment rates rose in all 14 of the state’s metropolitan areas. Rocky Mount had the highest unemployment rate (13.1 percent), followed by the Hickory-Morganton-Lenoir area (12.8 percent). Durham-Chapel Hill had the lowest rate (7.6 percent).
Because of the lack of seasonal adjustments, monthly fluctuations in local unemployment rates must be interpreted cautiously. This caveat is particularly important in January, when a variety of seasonal factors normally manifest themselves. The proper comparison, then, is not between December 2010 and January 2011, but between January 2010 and January 2011.
Compared to January 2010, unemployment rates were lower in 86 counties and every metro area. Yet compared to a year ago, 86 counties and 12 metro areas had smaller labor forces. Among metros, Winston-Salem posted the largest decline in the size of its labor force (-2.5 percent), followed by Hickory-Morganton-Lenoir (-2.3 percent) and Goldsboro (-2 percent). Asheville posted the largest gain (+1.1 percent).
“While seven of North Carolina’s metro areas—led by Raleigh-Cary, Burlington, and Asheville—recorded modest levels of job growth in 2010, overall growth levels were insufficient to drive down joblessness,” cautions Quinterno. “Much of the recent improvement in unemployment is due to the exiting of workers from the labor market. The contraction in the size of the labor force remains a worrisome development, and jobless individuals are at grave risk of being left behind.”
In the long term, any meaningful recovery will be driven by growth in the state’s three major metro regions: Charlotte, the Research Triangle, and the Piedmont Triad. Yet growth has been sluggish. Collectively, employment in these three metro regions has fallen by 5.9 percent since December 2007. The combined January unemployment rate in the three major metros equaled 9.7 percent. Of the three areas, the Research Triangle had the lowest unemployment rate (8.3 percent), followed by the Piedmont Triad (10.7 percent) and Charlotte (11.5 percent).
“Since December 2009, the month when then the state’s labor market bottomed out, most local job markets have experienced few meaningful improvements,” explains Quinterno. “Compounding the problem is the fact that annual data revisions have revealed the state’s job gap to be even larger than first thought. The current rate of job growth simple is insufficient to solve the problem of widespread joblessness.”


 Email Sign-Up