For the benefit week ending on October 9th, 13,080 North Carolinians filed initial claims for state unemployment insurance benefits, and 115,564 individuals applied for state-funded continuing benefits. Compared to the prior week, there were fewer initial and continuing claims. These figures come from data released by the U.S. Department of Labor.
Averaging new and continuing claims over a four-week period — a process that helps adjust for seasonal fluctuations and better illustrates trends — shows that an average of 13,767 initial claims were filed over the previous four weeks, along with an average of 116,581 continuing claims. Compared to the previous four-week period, there were fewer initial and continuing claims.
 One year ago, the four-week average for initial claims stood at 16,451 and the four-week average of continuing claims equaled 181,186.
While the number of claims has dropped over the past year, so has covered employment. Last week, covered employment totaled 3.7 million, down from 3.9 million a year ago.
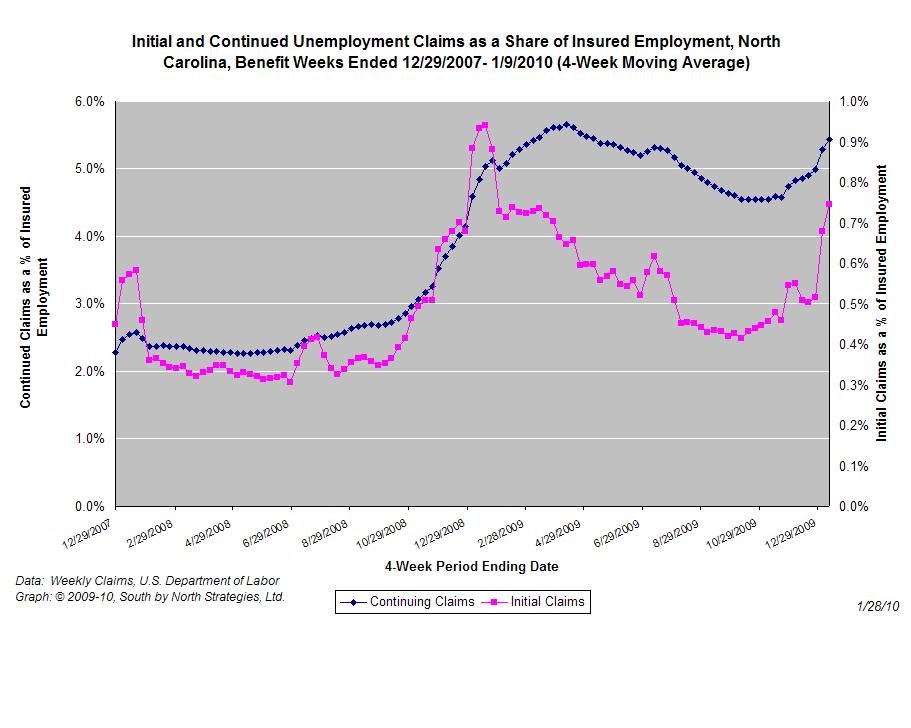
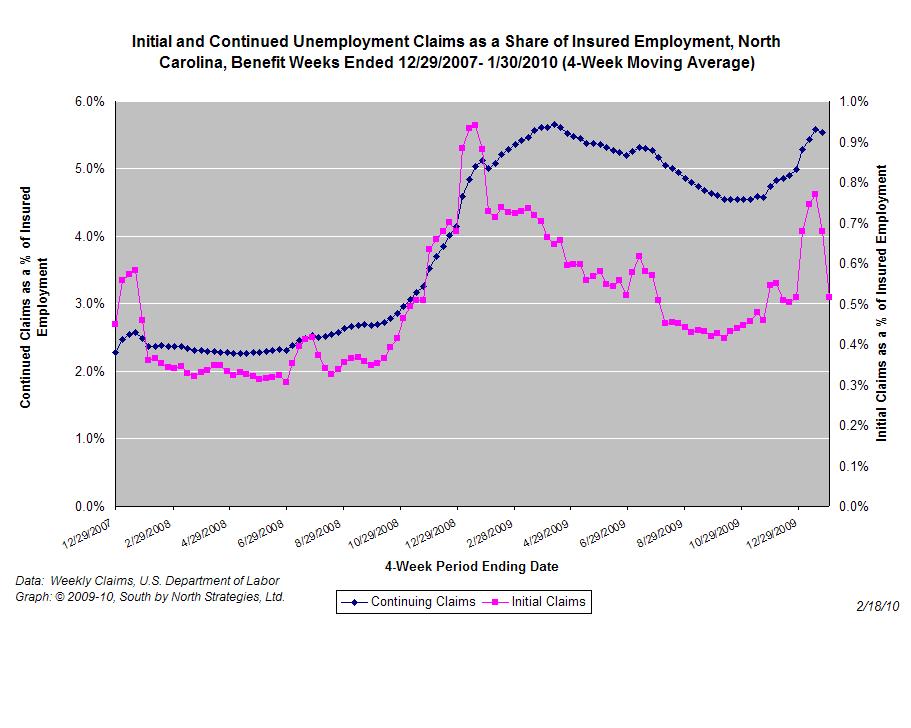
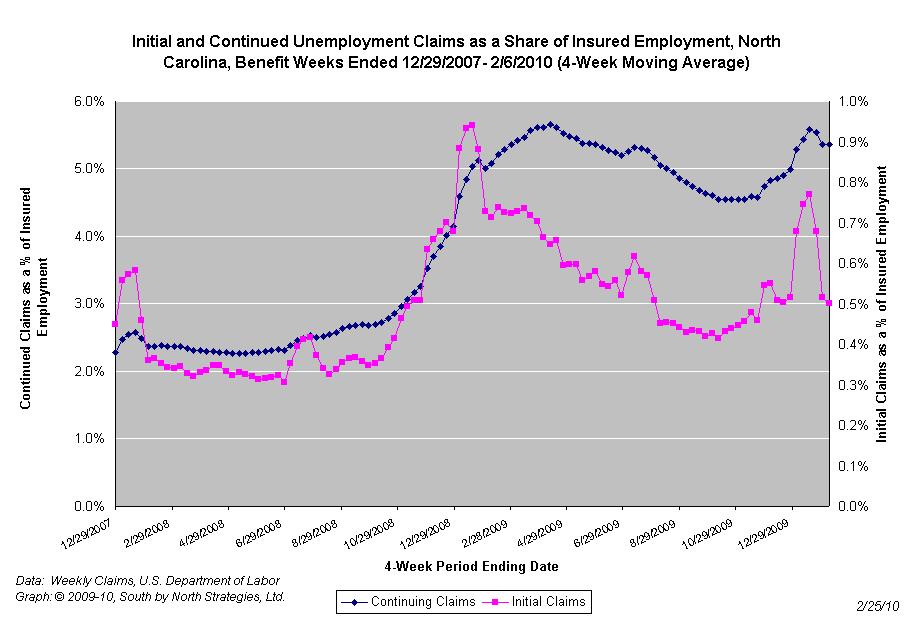
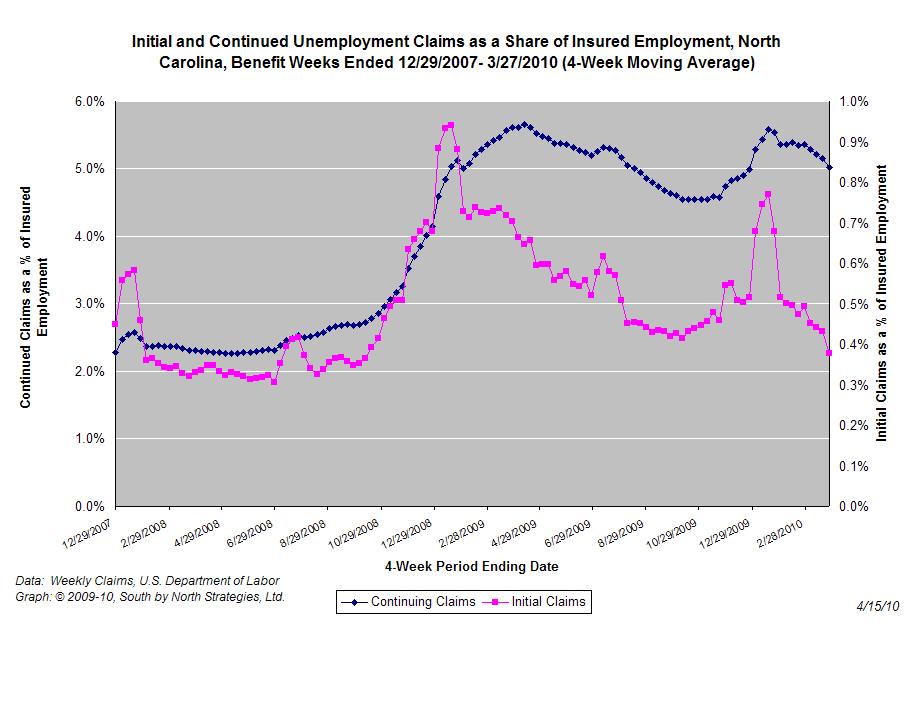
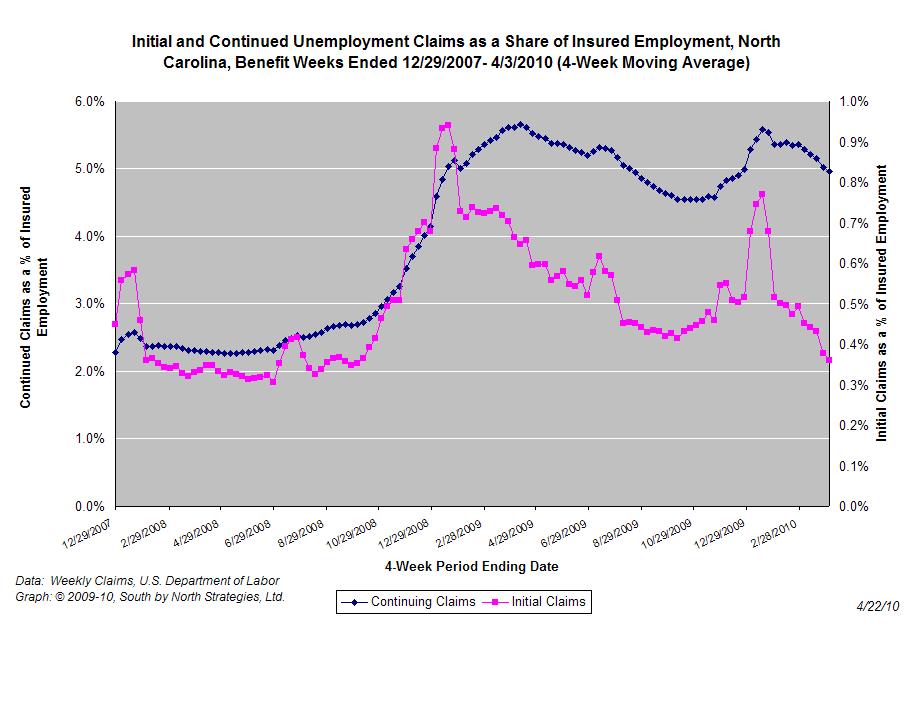
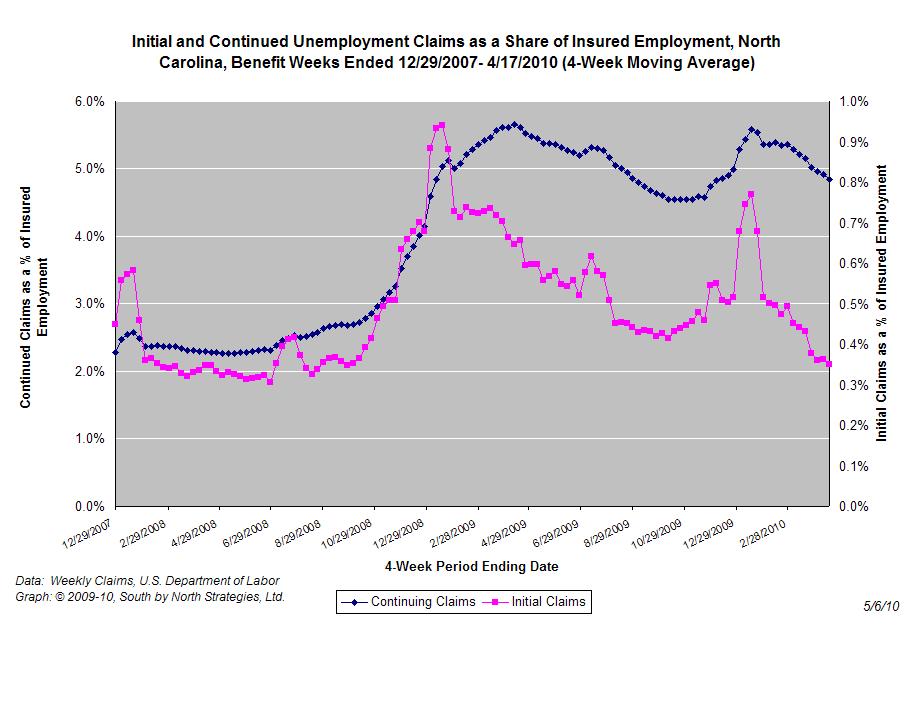
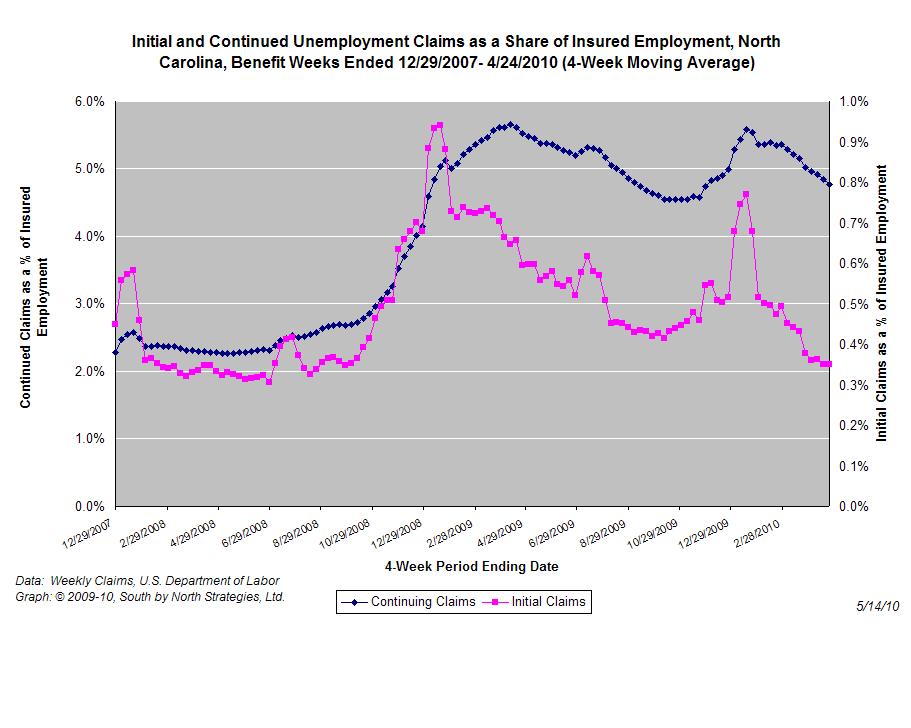
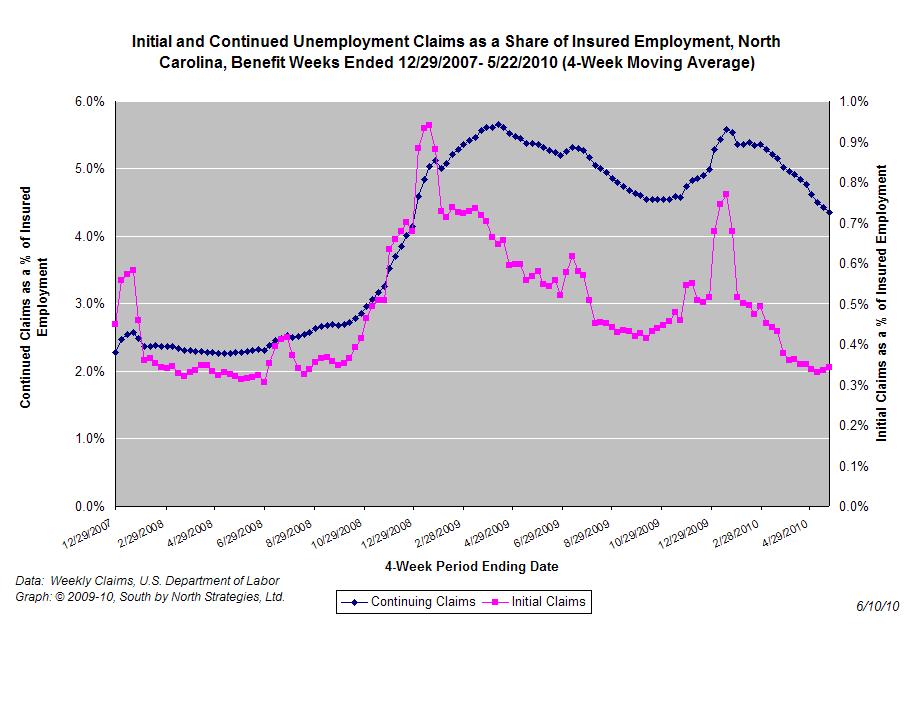
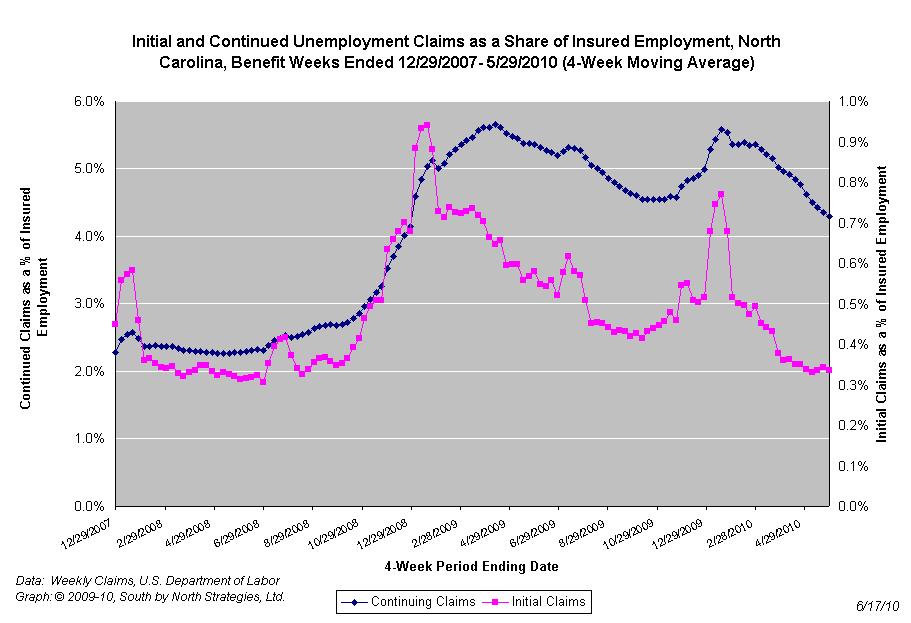
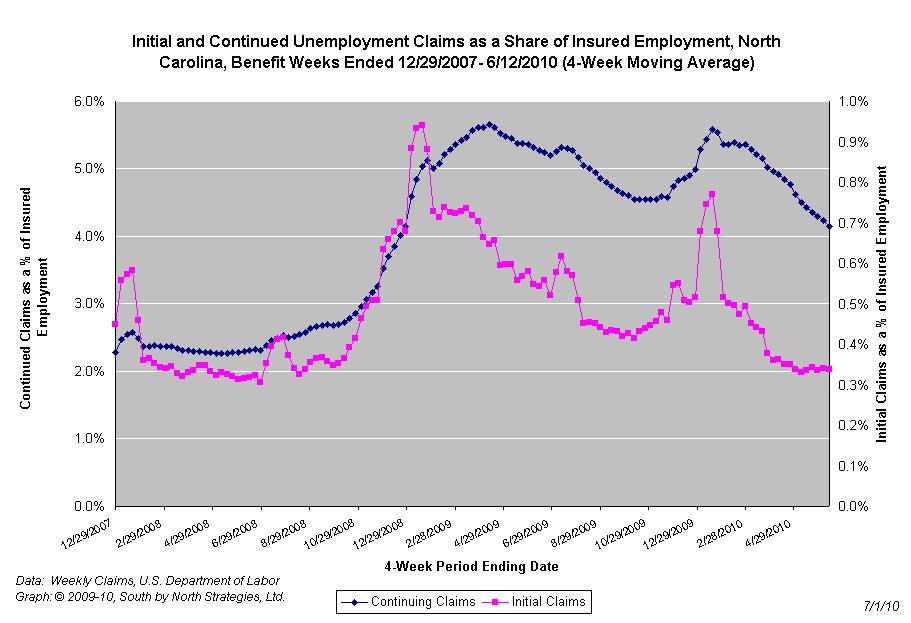
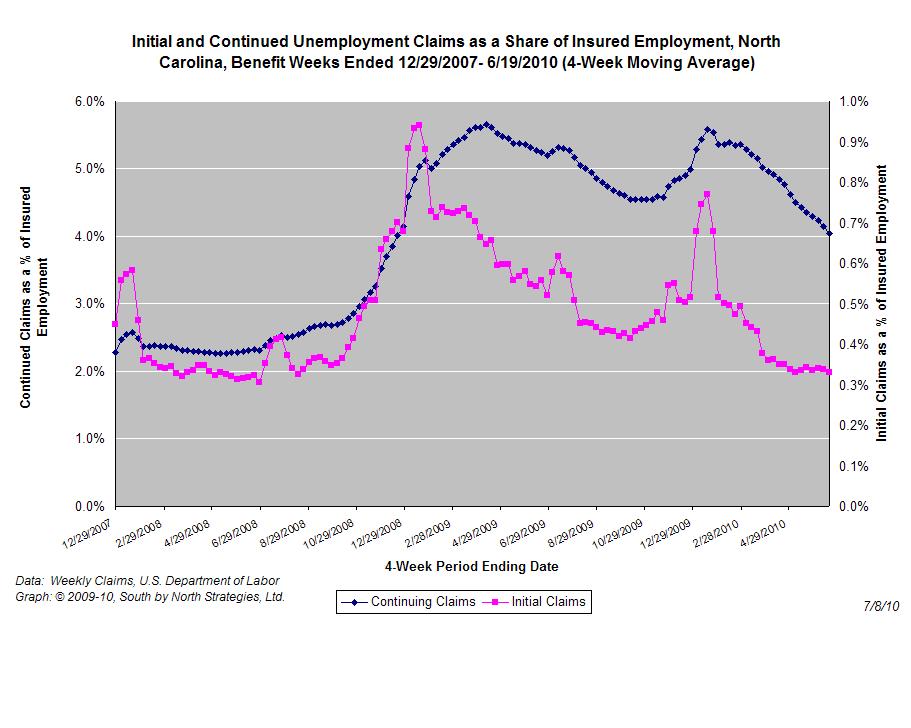
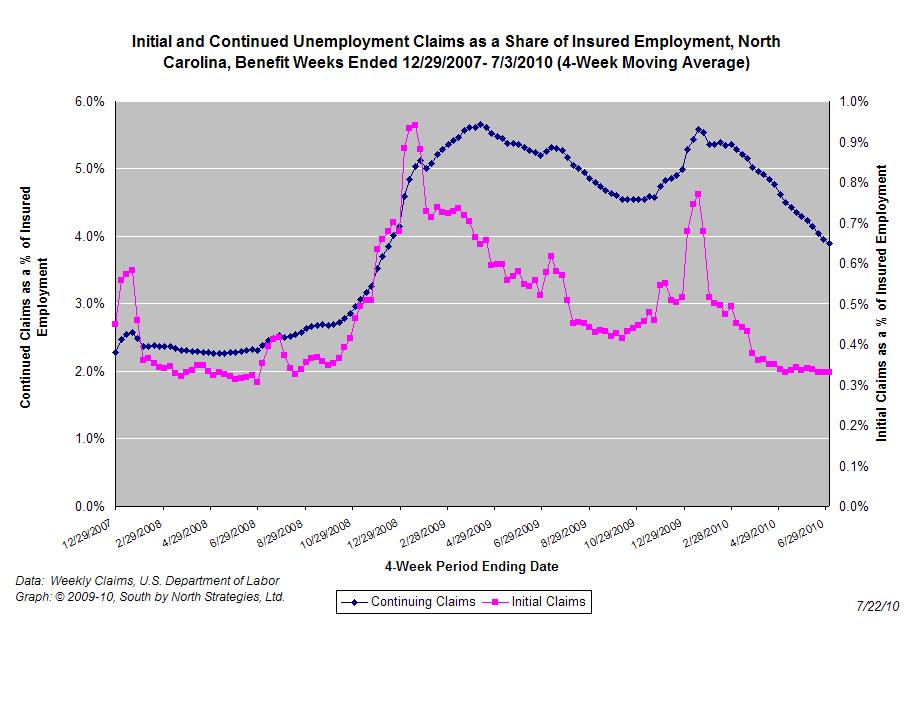
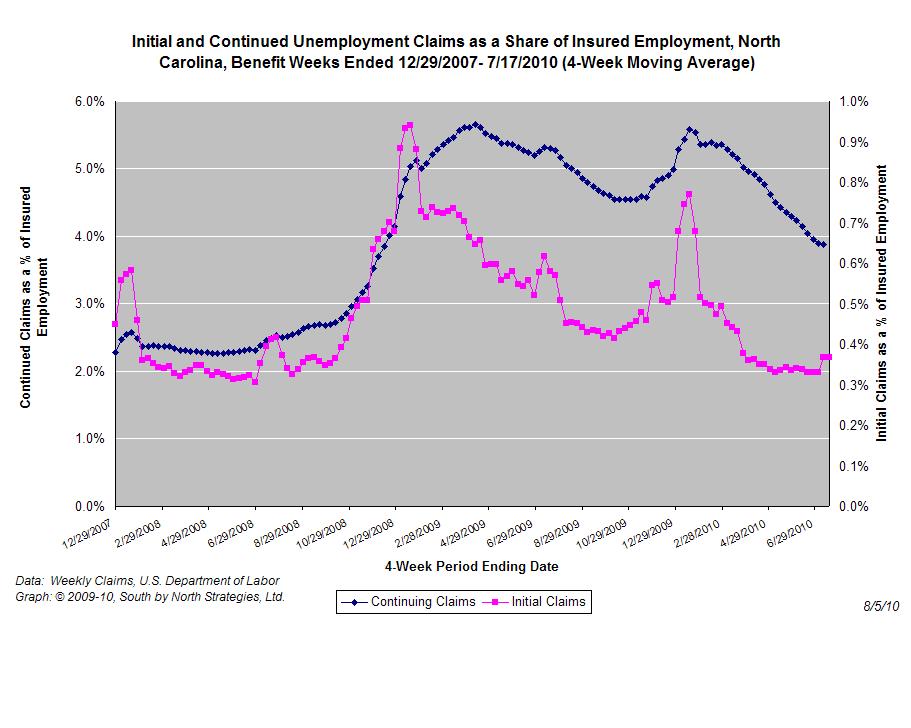
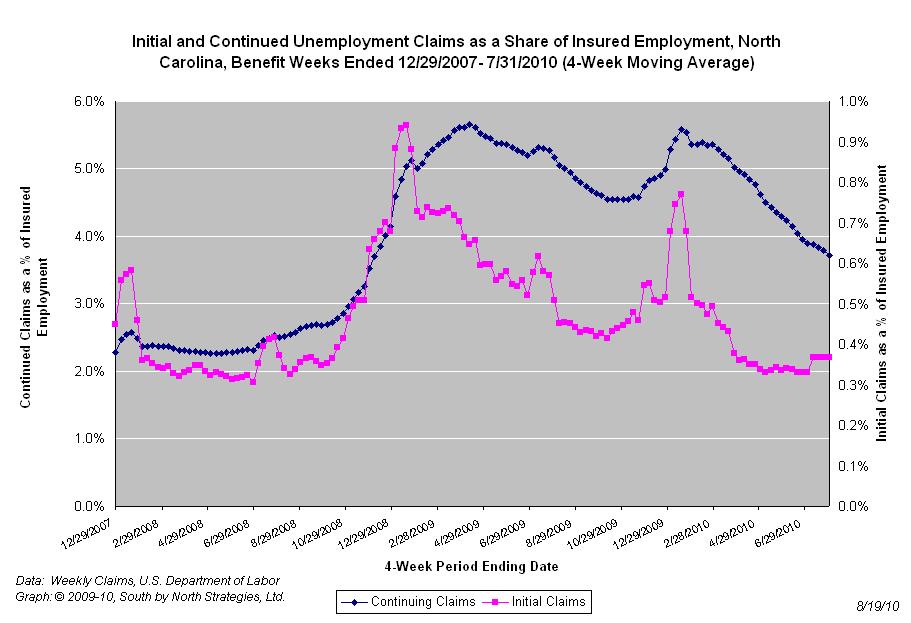
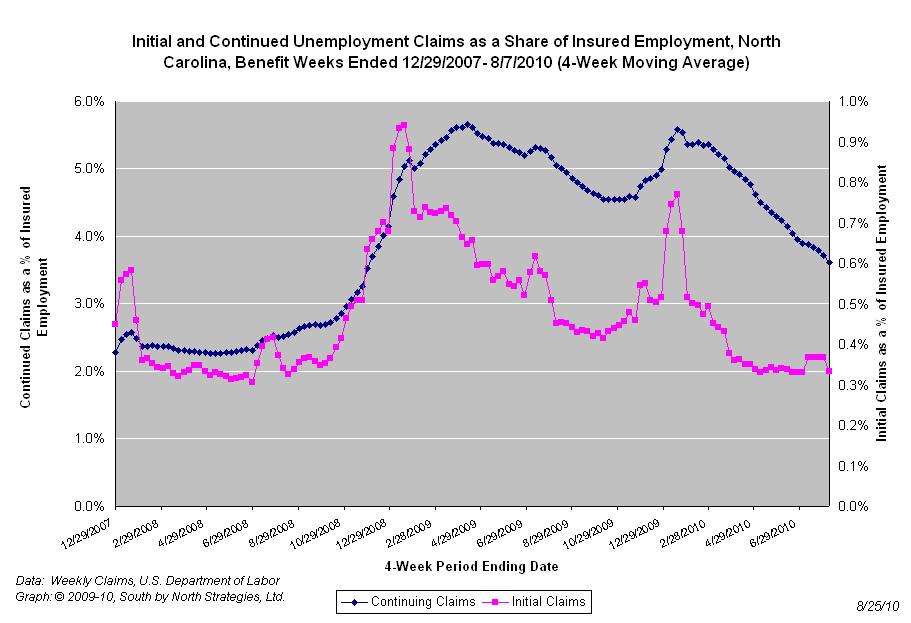
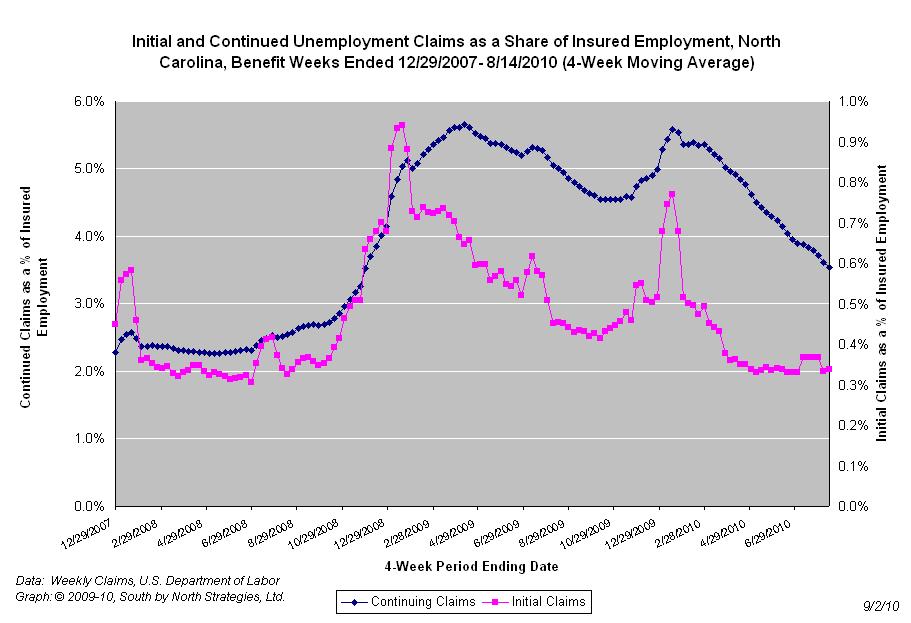
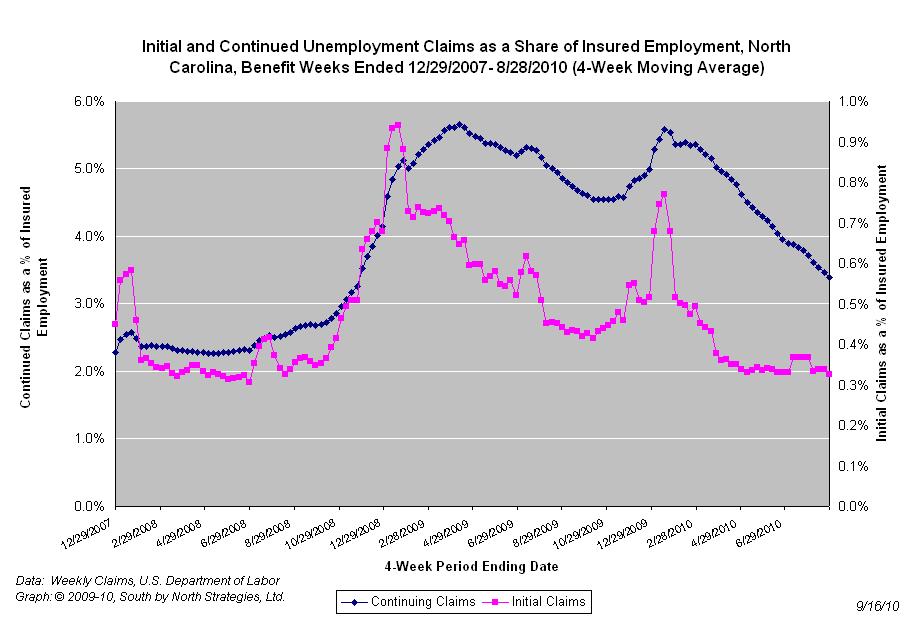
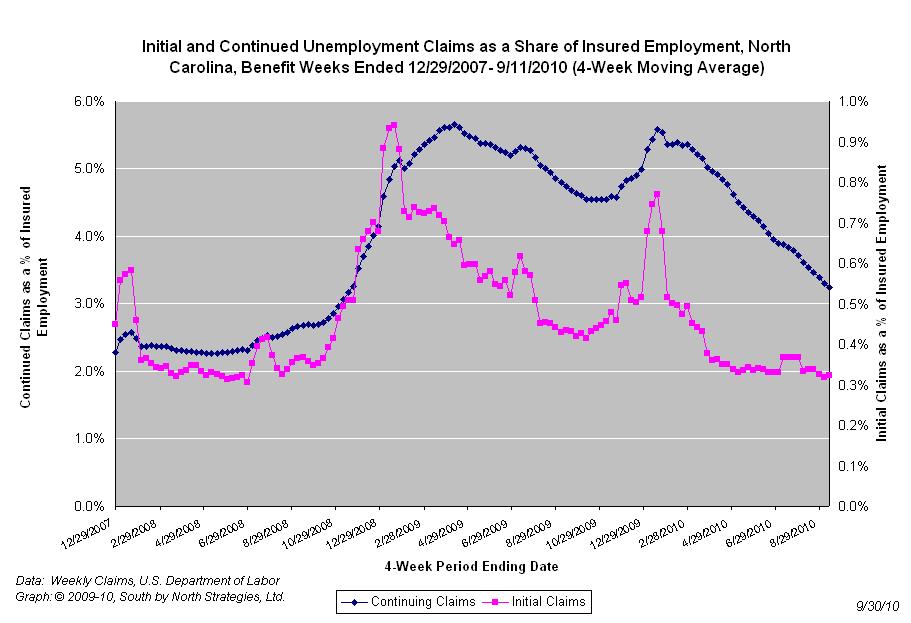
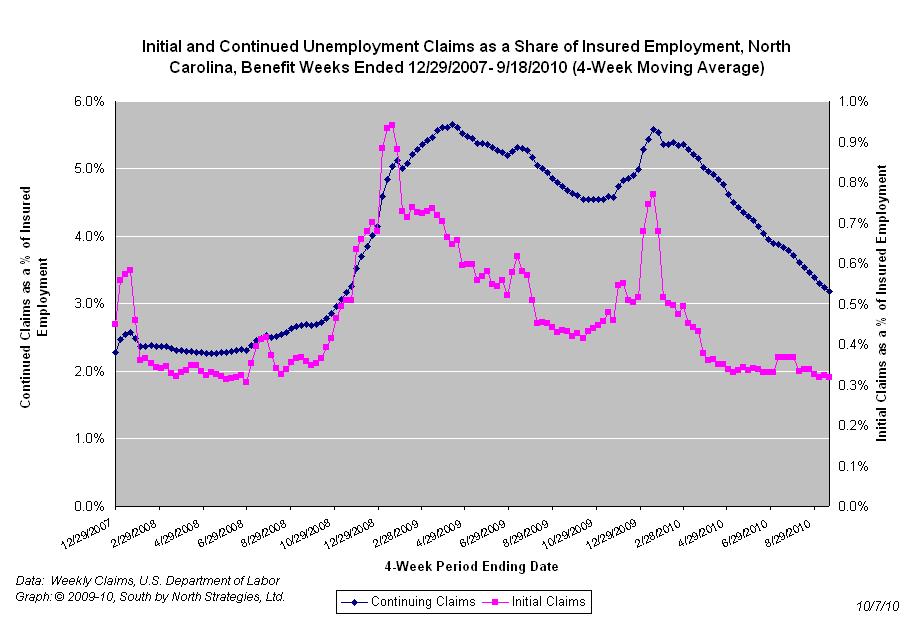
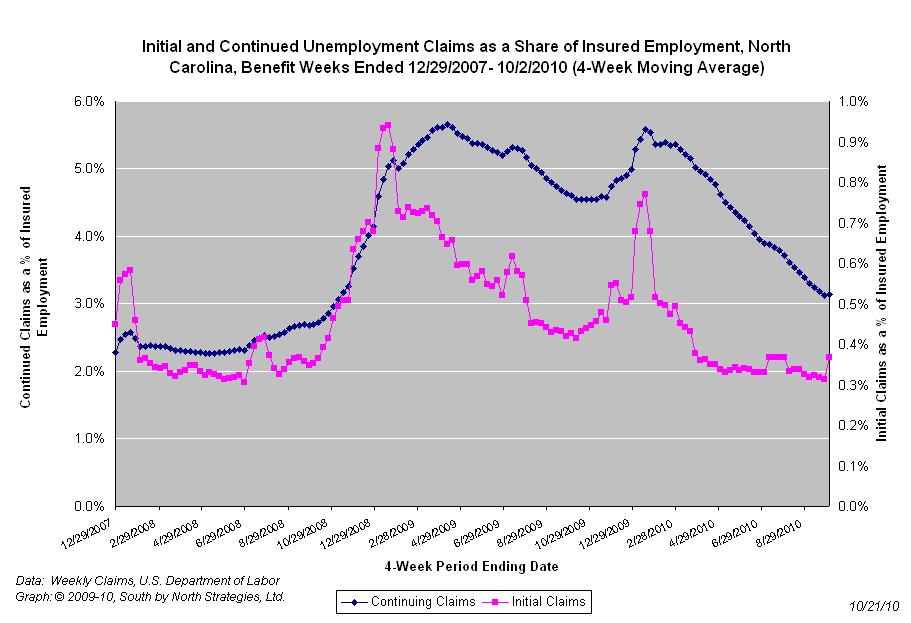
The graph (right) shows the changes in unemployment insurance claims (as a share of covered employment) in North Carolina since the recession’s start in December 2007.
Both new and continuing claims appear to have peaked for this business cycle, and the four-week averages of new and continuing claims have fallen considerably. Yet continuing claims remain at an elevated level, which suggests that unemployed individuals are finding it difficult to find new positions.
Also, little change has occurred within recent months. Since April 2010, the four-week average of initial claims consistently has ranged between 13,987 and 11,200.


 Email Sign-Up