Policy Points

27.08.2010 News Releases, Policy Points Comments Off on NC Local Employment Sags in July

NC Local Employment Sags in July

CHAPEL HILL (August 27, 2010) – North Carolina’s local labor markets performed poorly in July, according to preliminary data released today by the Employment Security Commission. Last month, 54 counties posted double-digit unemployment rates, while 20 counties recorded rates of at least 12 percent.

“North Carolina’s labor market struggled in July,” says John Quinterno, a principal with South by North Strategies, Ltd., a research firm specializing in economic and social policy. “Although conditions in some communities improved somewhat, joblessness remains a serious problem across the state.”

Since the onset of the recession in December 2007, North Carolina has shed 6.6 percent of its payroll employment base (-276,700 positions) and has watched its unadjusted unemployment rate climb from 4.7 percent to 9.9 percent.

Every part of the state experienced weak labor markets in July. Unemployment rates exceeded 10 percent in 54 counties, and in 20 counties, at least 12 percent of the labor force was jobless and actively seeking work. County unemployment rates ranged from 4.5 percent in Currituck County to 16.2 percent in Scotland County.

“Labor markets in non-metropolitan communities remain particularly weak,” adds Quinterno. “Last month, 10.8 percent of the non-metro labor force was unemployed, compared to 9.5 percent of the metro one. More alarmingly, the non-metropolitan labor force continued to shrink. Since December 2007, the non-metropolitan labor force has contracted by 1.5 percent. Many of those missing individuals are effectively jobless.”

Last month, unemployment rates fell in all 14 of the state’s metropolitan areas. Rocky Mount had the highest unemployment rate (12.8 percent), followed by the Hickory-Morganton-Lenoir area (12.7 percent). Durham-Chapel Hill had the lowest rate at 7.3 percent.

“Because of the lack of seasonal adjustments, monthly fluctuations in local unemployment rates must be interpreted cautiously, particularly during the volatile summer months,” warns Quinterno. “A better comparison is an annual one.”

Compared to July 2009, unemployment rates were the same or lower in 96 counties and every metro area. Yet compared to a year ago, 81 counties and 8 metro areas had smaller labor forces. Among metros, Hickory-Morganton-Lenoir posted the largest decline in the size of its labor force (-4.5 percent), followed by Burlington (-2.8 percent). Jacksonville posted the largest gain (+7.1 percent).

“Recent drops in unemployment rates have been driven not by improvements in underlying conditions, but by workers abandoning the job market,” cautions Quinterno. ”The robust job growth needed to absorb displaced individuals and new workers is not happening. Much of the little growth occurred earlier in the year has been lost over the summer.”

In the long term, any meaningful recovery will be driven by growth in the state’s three major metro regions: Charlotte, the Research Triangle, and the Piedmont Triad. Yet job growth in 2010 has been sluggish. Collectively, employment in these three major metro regions has fallen by 3.7 percent since the start of the recession. The overall July unemployment rate in the major metros equaled 9.5 percent. Of the three areas, the Research Triangle had the lowest July unemployment rate (8 percent), followed by the Piedmont Triad (10.4 percent) and Charlotte (11.6 percent).

“Recent trends have exposed just how weak local economies are,” observes Quinterno. “Private-sector activity remains anemic and is not replacing the economic support provided by various policy measures that have ended or are about to end. What little recovery we’ve had appears in danger of stalling out.”

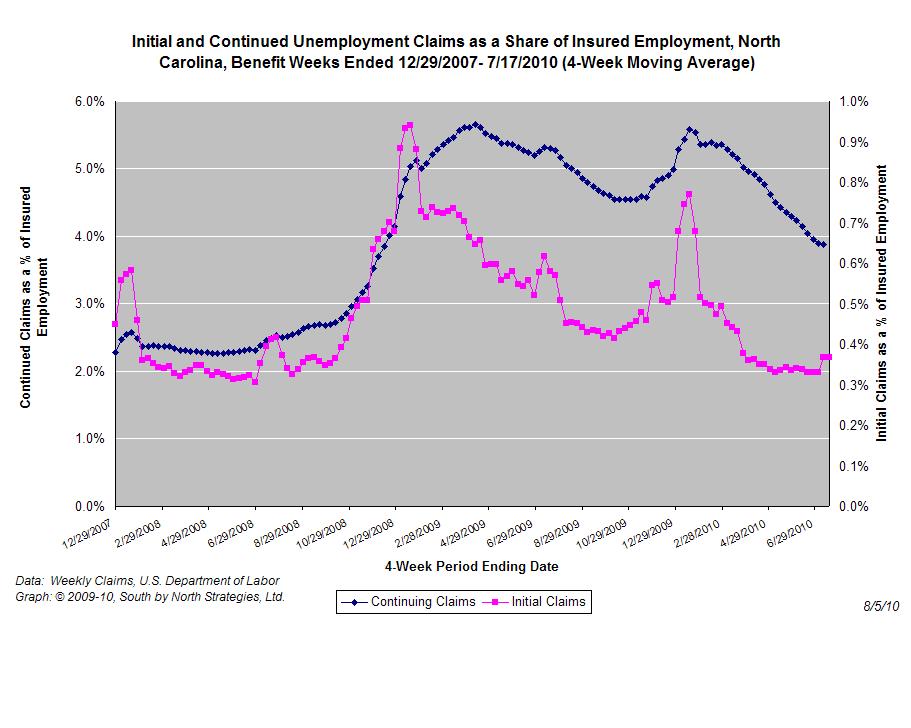
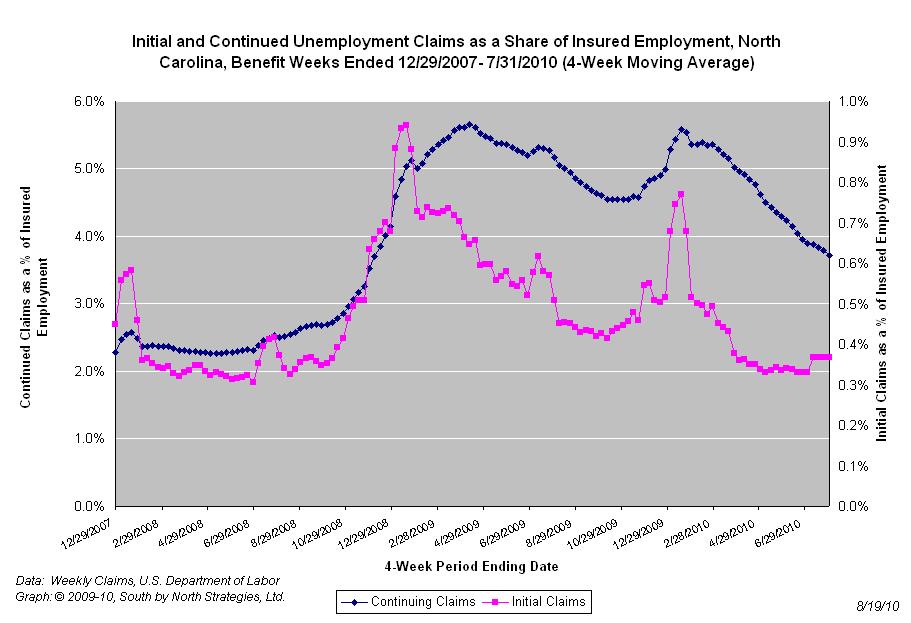
One somewhat bright spot in the July report was the boost that unemployment insurance benefits provided to individual households and the state’s economy. Explains Quinterno: “Over the past 12 months, unemployed North Carolinians received $5.4 billion in regular state payments and federal emergency benefits. Those payments sparked an estimated $8.9 billion in statewide economic activity.”

27.08.2010 Policy Points Comments Off on College Dropout Factories

College Dropout Factories

An article in the college issue of The Washington Monthly considers the problem of “college dropout factories.”

School reformers, including President Obama, often talk about high school “dropout factories.” These are the roughly 2,000 public high schools, about 15 percent of the total, with the nation’s highest dropout rates. The average student at these schools has about a fifty-fifty chance of graduating, according to the Everyone Graduates Center at Johns Hopkins University. But the term “dropout factory” is also applicable to colleges. The Washington Monthly and Education Sector, an independent think tank, looked at the 15 percent of colleges and universities with the worst graduation records—about 200 schools in all—and found that the graduation rate at these schools is 26 percent …. America’s “college dropout factories,” in other words, are twice as bad at graduating their students as the worst high schools are at graduating theirs.

Continues the article:

Nearly everyone considers it scandalous when poor kids are shunted into lousy high schools with low graduation rates, and we have no problem naming and shaming those schools. Bad primary and secondary schools are frequently the subject of front-page newspaper investigations and the backdrop for speeches by reformist mayors and school district chiefs. But bad colleges are spared such scrutiny. This indifference is inexcusable now that a postsecondary credential has become virtually indispensable to anyone hoping to lead a middle-class life. If we want better outcomes in higher education, we need to hold dropout factories like Chicago State [University] accountable in the same way the Obama administration proposes to hold underperforming high schools accountable: transform them—or shut them down.

The article also notes that many schools with similar student demographics to those found at “dropout factories” succeed in graduating much larger shares of their students. The key is to put student success first.

Take North Carolina Central University, which enrolls 8,500 students. About 85 percent of students at both schools are black. NCCU’s median SAT score is 840, the approximate equivalent of about 17 on the ACT, even lower than Chicago State’s average ACT of 18. The difference, however, is that NCCU tries to work with the students it has. The result: while Chicago State graduates about 13 percent of its students, NCCU graduates about 50 percent. “We have the philosophy that if we admit the students into this institution we have a great responsibility in ensuring their success,” says Bernice Duffy Johnson, dean of the school’s University College, which focuses on supporting students during their first two years.
..
Students entering NCCU are told from the start that they are expected to have a goal of graduating in four years. The University College keeps students together in groups and assigns them advisers who must approve all major academic decisions and meet with students frequently. NCCU students even sign a contract upon arriving, a document that lays out the goals of what they are going to accomplish. If they start to struggle, they sign an additional contract that commits them to even closer monitoring. Above all, what drives places like NCCU is a culture of experimentation and data collection. The administrators track students, and they track results. If something works, they keep doing it. If it doesn’t, they try something else.

26.08.2010 Policy Points Comments Off on Around The Dial – August 26

Around The Dial – August 26

Economic policy reports, blog postings, and media stories of interest:

26.08.2010 Policy Points Comments Off on NC Unemployment Claims: Week of 8/7

NC Unemployment Claims: Week of 8/7

For the benefit week ending on August 7th, 12,873 North Carolinians filed initial claims for state unemployment insurance benefits, and 133,022 individuals applied for state-funded continuing benefits. Compared to the prior week, there were fewer initial and continuing claims.  These figures come from new data released by the U.S. Department of Labor.

Averaging new and continuing claims over a four-week period — a process that helps adjust for seasonal fluctuations and better illustrates trends — shows that an average of 12,541 initial claims were filed over the previous four weeks, along with an average of 135,928 continuing claims. Compared to the previous four-week period, there were fewer initial and continuing claims.

One year ago, the four-week average for initial claims stood at 18,089 and the four-week average of continuing claims equaled 202,349.

While the number of claims has dropped over the past year, so has covered employment. Last week, covered employment totaled 3.8 million, down from 4 million a year ago.

The graph (right) shows the changes in unemployment insurance claims (as a share of covered employment) in North Carolina since the recession’s start in December 2007.

Both new and continuing claims appear to have peaked for this business cycle, and the four-week averages of new and continuing claims have fallen considerably. Yet continuing claims remain at an elevated level, which suggests that unemployed individuals are finding it difficult to find new positions.

Also, little change has occurred within recent months. Since April 2010, the four-week average of initial claims consistently has ranged between 13,987 and 12,541.

26.08.2010 Policy Points Comments Off on Service Activity in The South Atlantic: August

Service Activity in The South Atlantic: August

From the Federal Reserve Bank of Richmond’s latest survey of service-sector activity in the South Atlantic (District of Columbia, Maryland, North Carolina, South Carolina, Virginia and West Virginia):

Service sector activity pulled back in August, according to the latest survey by the Federal Reserve Bank of Richmond. After three months of nearly flat sales, overall retail revenues declined, led by a sharp drop in big-ticket sales. Depressed shopper traffic added to the slump in retail activity. Merchants reduced inventories as they predicted weak demand for their products in the coming six months. Revenues at non-retail services firms also dropped in August, following five months of mild expansion. Services providers softened their outlook regarding demand for their services in the six months ahead.

Turning to service sector labor markets, job reductions continued, although average wage growth strengthened across the board.

Price growth slowed somewhat at retail establishments and ticked up at non-retail services firms, raising overall price growth slightly.