Policy Points
08.03.2013
News Releases, Policy Points
CHAPEL HILL, NC (March 8, 2013) – The national labor market added 236,000 more jobs than it lost in February. The unemployment rate, meanwhile, dropped to 7.7 percent. Despite recent increases in payroll employment levels, unemployment remains elevated, with the labor market essentially having run in place over the last six months.
“February was the 29th-straight month of job growth recorded in the United States,” said John Quinterno, a principal with South by North Strategies, Ltd., a research firm specializing in economic and social policy. “Over the past three months, the national economy has netted an average of 191,000 jobs, a pace that, while positive, is insufficient to drive unemployment down to pre-recessionary levels. More than 3.5 years into a recovery, the unemployment rate remains well above the December 2007 level of 5 percent.”
In February, the nation’s employers added 236,000 more payroll positions than they cut. Gains occurred entirely in the private sector (+246,000), while government employers eliminated 10,000 more positions than they added, due mainly to reductions by state governments. Moreover, the payroll employment numbers for December and January underwent revisions; with the updates, the economy gained 338,000 jobs over those two months, not the 353,000 positions previously reported.
Within the private sector, payroll levels rose the most in the professional and business services sector (+73,000, with 60.4 percent of the gain attributable to the administrative and waste services subsector), followed by construction (+48,000), and the trade, transportation and utilities sector (+30,000, with 79 percent of the gain attributable to the retail trade subsector). Payroll levels in every other private supersector either rose or held steady.
“Over the last 14 months, the American economy has gained 2.5 million more payroll positions that it has lost,” noted Quinterno. “The current average monthly rate of job growth—some 182,000 positions per month—nevertheless is insufficient to fill the sizable jobs gap caused by the most recent recession.”
Slack labor market conditions were evident in the February household survey. Last month, 12 million Americans (7.7 percent of the labor force) were jobless and seeking work. While the unemployment rate dropped between January and February, the decline was due to a dip in the labor force participation rate. In February, the size of the labor force contracted by 130,000 persons, as the share of the population participating in the labor force fell to 63.5 percent, a rate lower than the one recorded a year ago. On a positive note, compared to a year ago, more Americans were working in February, and fewer persons were unemployed.
Last month, the unemployment rate was higher among adult male workers than female ones (7.1 percent versus 7 percent). Unemployment rates were higher among Black (13.8 percent) and Hispanic workers (9.6 percent) than among White ones (6.8 percent). The unemployment rate among teenagers was 25.1 percent. Moreover, 6.9 percent of all veterans were unemployed; the rate among recent veterans (served after September 2001) was 9.4 percent. At the same time, 12.3 percent of Americans with disabilities were jobless and seeking work (not seasonally adjusted).
Jobs remained scarce in February. Last month, the underemployment rate equaled 14.3 percent. Among unemployed workers, 40.2 percent had been jobless for at least six, and the average spell of unemployment was 36.9 weeks. The leading cause of unemployment remained a job loss or the completion of a temporary job, which was the reason cited by 53.9 percent of unemployed persons in February. Another 27.6 percent of unemployed persons were re-entrants to the labor market, while 10.6 percent were new entrants. Voluntary job leavers accounted for the remaining 7.9 percent of the total.
“Despite the job growth experienced in February, the American labor market remains listless,” observed Quinterno. “The rate of job growth is subpar relative to the problems facing the national labor market, and the labor market still is not on pace to generate enough jobs for all the Americans who need work.”
07.03.2013
Policy Points
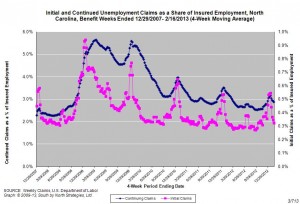
For the benefit week ending on February 16, 2013, some 12,842 North Carolinians filed initial claims for state unemployment insurance benefits and 108,466 individuals applied for state-funded continuing benefits. Compared to the prior week, there were more initial and more continuing claims. These figures come from data released by the US Department of Labor.
Averaging new and continuing claims over a four-week period — a process that helps adjust for seasonal fluctuations and better illustrates trends — shows that an average of 12,304 initial claims were filed over the previous four weeks, along with an average of 109,498 continuing claims. Compared to the previous four-week period, the average number of initial claims was lower, as was the average number of continuing claims.
One year ago, the four-week average for initial claims stood at 12,002, and the four-week average of continuing claims equaled 121,240.
In recent months covered employment has increased and now exceeds the level recorded a year ago (3.8 million versus 3.7 million). Nevertheless, there are still fewer covered workers than there were in January 2008, which means that payrolls are smaller today than they were approximately five years ago.
The graph shows the changes in unemployment insurance claims measured as a share of covered employment in North Carolina since the recession’s start in December 2007. 
Both new and continuing claims appear to have peaked for this cycle, and the four-week averages of new and continuing claims have fallen considerably. Yet continuing claims remain at an elevated level, which suggests that unemployed individuals are finding it difficult to find new positions.
28.02.2013
Policy Points
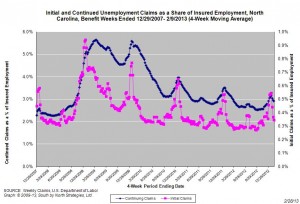
For the benefit week ending on February 9, 2013, some 10,847 North Carolinians filed initial claims for state unemployment insurance benefits and 107,301 individuals applied for state-funded continuing benefits. Compared to the prior week, there were fewer initial and fewer continuing claims. These figures come from data released by the US Department of Labor.
Averaging new and continuing claims over a four-week period — a process that helps adjust for seasonal fluctuations and better illustrates trends — shows that an average of 13,137 initial claims were filed over the previous four weeks, along with an average of 110,778 continuing claims. Compared to the previous four-week period, the average number of initial claims was lower, as was the average number of continuing claims.
One year ago, the four-week average for initial claims stood at 12,231, and the four-week average of continuing claims equaled 122,768.
In recent months covered employment has increased and now exceeds the level recorded a year ago (3.8 million versus 3.7 million). Nevertheless, there are still fewer covered workers than there were in January 2008, which means that payrolls are smaller today than they were approximately five years ago.
The graph shows the changes in unemployment insurance claims measured as a share of covered employment in North Carolina since the recession’s start in December 2007. 
Both new and continuing claims appear to have peaked for this cycle, and the four-week averages of new and continuing claims have fallen considerably. Yet continuing claims remain at an elevated level, which suggests that unemployed individuals are finding it difficult to find new positions.
21.02.2013
Policy Points
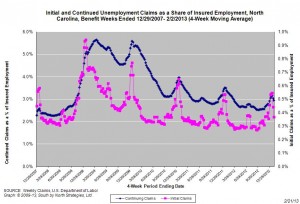
For the benefit week ending on February 2, 2013, some 12,031 North Carolinians filed initial claims for state unemployment insurance benefits and 109,844 individuals applied for state-funded continuing benefits. Compared to the prior week, there were fewer initial and fewer continuing claims. These figures come from data released by the US Department of Labor.
Averaging new and continuing claims over a four-week period — a process that helps adjust for seasonal fluctuations and better illustrates trends — shows that an average of 13,961 initial claims were filed over the previous four weeks, along with an average of 111,890 continuing claims. Compared to the previous four-week period, the average number of initial claims was lower, as was the average number of continuing claims.
One year ago, the four-week average for initial claims stood at 12,712, and the four-week average of continuing claims equaled 124,240.
In recent months covered employment has increased and now exceeds the level recorded a year ago (3.8 million versus 3.7 million). Nevertheless, there are still fewer covered workers than there were in January 2008, which means that payrolls are smaller today than they were approximately five years ago.
The graph shows the changes in unemployment insurance claims measured as a share of covered employment in North Carolina since the recession’s start in December 2007. 
Both new and continuing claims appear to have peaked for this cycle, and the four-week averages of new and continuing claims have fallen considerably. Yet continuing claims remain at an elevated level, which suggests that unemployed individuals are finding it difficult to find new positions.
14.02.2013
Policy Points
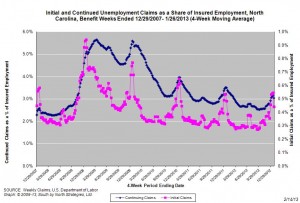
For the benefit week ending on January 26, 2013, some 13,494 North Carolinians filed initial claims for state unemployment insurance benefits and 112,381 individuals applied for state-funded continuing benefits. Compared to the prior week, there were fewer initial and fewer continuing claims. These figures come from data released by the US Department of Labor.
Averaging new and continuing claims over a four-week period — a process that helps adjust for seasonal fluctuations and better illustrates trends — shows that an average of 16,812 initial claims were filed over the previous four weeks, along with an average of 115,520 continuing claims. Compared to the previous four-week period, the average number of initial claims was lower, as was the average number of continuing claims.
One year ago, the four-week average for initial claims stood at 14,483, and the four-week average of continuing claims equaled 126,586.
In recent months covered employment has increased and now exceeds the level recorded a year ago (3.8 million versus 3.7 million). Nevertheless, there are still fewer covered workers than there were in January 2008, which means that payrolls are smaller today than they were five years ago.
The graph shows the changes in unemployment insurance claims measured as a share of covered employment in North Carolina since the recession’s start in December 2007. 
Both new and continuing claims appear to have peaked for this cycle, and the four-week averages of new and continuing claims have fallen considerably. Yet continuing claims remain at an elevated level, which suggests that unemployed individuals are finding it difficult to find new positions.


 Email Sign-Up
 RSS Feed