Policy Points
26.04.2010
News Releases, Policy Points
South by North Strategies’ analysis of local employment conditions in March was featured in a number of media outlets.
26.04.2010
Policy Points
A recent study by the Federal Reserve Bank of Richmond asks how unemployment rates during the current recession compare to those from other postwar recessions. Because the current labor force is older, direct comparisons of unemployment rates generate misleading perceptions unless the numbers are adjusted for age differences. Making those adjustments (graph, below) shows that the national unemployment rate during the fourth quarter of 2009 equaled 11.7 percent, which is the highest rate recorded since 1948.

23.04.2010
Policy Points
Economic policy reports, blog postings, and media stories of interest:
23.04.2010
Policy Points
Local labor market conditions across North Carolina remained weak in March, based on preliminary data released today by the Employment Security Commission. In March 75 counties posted double-digit unemployment rates, and 43 counties recorded unemployment rates of at least 12 percent.
Every part of the state experienced weak labor markets. Unemployment rates exceeded 10 percent in 75 counties, and in 43 counties, at least 12 percent of the labor force was jobless and actively seeking work. County unemployment rates ranged from 6.4 percent in Orange County to 17.2 percent in Graham County.
One piece of good news contained in the March report is evidence of the powerful role that unemployment insurance has played in blunting the recession. Over the last 12 months, the Employment Security Commission paid out $5.4 billion in regular state payments, emergency federal benefits, and additional federal compensation. These payments not only helped households coping with a job loss, but they also generated an estimated $8.8 billion in statewide economic activity.
Click here to read South by North Strategies’ full analysis.
23.04.2010
Policy Points
Economic conditions remained tepid across much of the nation in March, according to the newest State Coincident Indexes Report prepared by the Federal Reserve Bank of Philadelphia.
In March coincident indexes moved in a positive direction in 35 states and in a negative direction in ten states. No changes occurred in five states.
 The map to the right, which is taken from the Reserve Bank’s survey, shows the three-month changes in coincident indicators by state. Positive numbers denote improvements in economic conditions, and negative numbers refer to declines.
Over the last three months, coincident indexes increased in 31 states, decreased in 17 states and held steady in two states.
During the same three-month period, North Carolina’s coincident index moved in a positive direction, suggesting some improvements in local economic conditions.


 Email Sign-Up
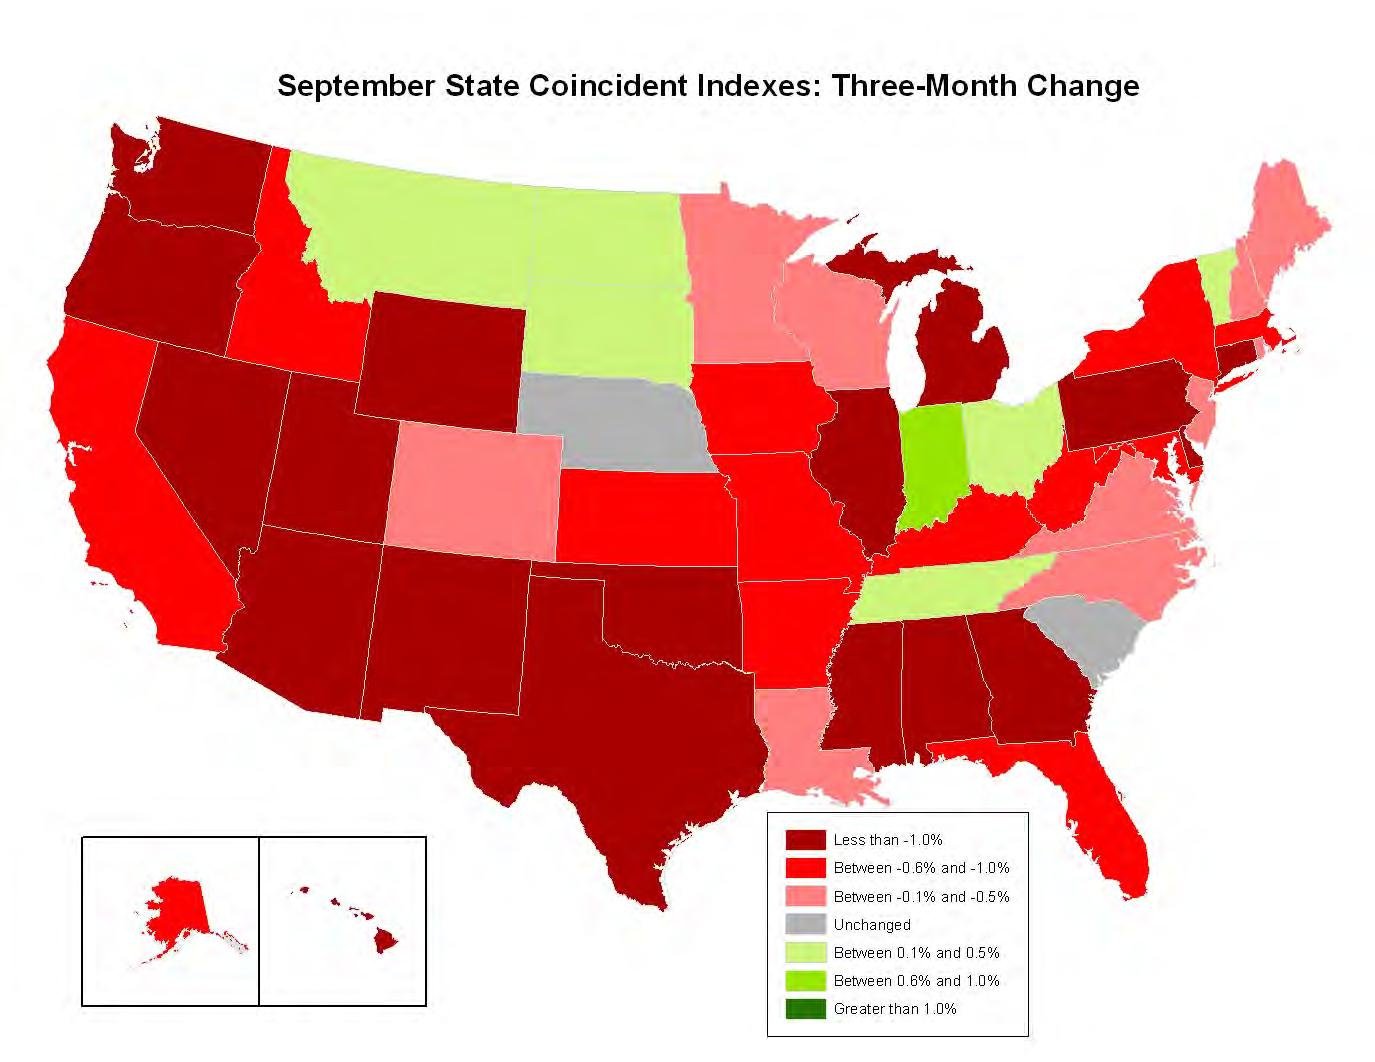