15.04.2010
Policy Points
For the benefit week ending on March 27th, 12,323 North Carolinians filed initial claims for state unemployment insurance benefits, and 1987,429 individuals applied for state-funded continuing benefits. Compared to the prior week, there were fewer initial and continuing claims. (Note the filing week had one fewer day due to the Good Friday state government holiday.) These figures come from data released today by the U.S. Department of Labor.
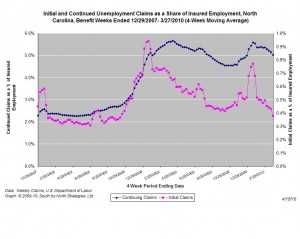
Averaging new and continuing claims over a four-week period — a process that helps adjust for seasonal fluctuations and better illustrates trends — shows that an average of 14,610 initial claims were filed over the last four weeks, along with an average of 194,750 claims. Compared to the previous four-week period, both initial and continuing claims were lower.
 One year ago, the four-week average for initial claims stood at 28,393 and the four-week average of continuing claims equaled 226,231.
The graph (right) shows the changes in unemployment insurance claims (as a share of covered employment) in North Carolina since the recession’s start in December 2007.
Both new and continuing claims appear to have peaked for this business cycle, and the four-week average of new claims has fallen to a level last seen in October 2008. Yet continuing claims remain at an elevated level, which suggests that unemployed individuals are finding it extremely difficult to find new positions.
15.04.2010
Policy Points
A little tax day humor, courtesy of The Daily Show.
14.04.2010
Policy Points
Economic policy reports, blog postings, and media stories of interest:
14.04.2010
Policy Points
A new report from the N.C Budget and Tax Center projects that state legislators will confront a $1.6 billion shortfall when they convene to prepare the state budget for fiscal year 2010-2011. From the Center’s report:
Unfortunately for state leaders, budget projections for this year and the next indicate their work is far from over. The state will face a budget shortfall of approximately $1.6 billion in FY 2010-11 and an estimated
$3.3 billion to $4.4 billion in FY 2011-12.
—
State leaders must continue to take a balanced approach to managing this ongoing challenge by finding efficiencies, tapping all available resources, eliminating ineffective tax expenditures, improving tax collections, rethinking the distribution of state and local responsibilities, making spending reduction decisions based on well-grounded priorities, and, if necessary, raising additional revenue.
14.04.2010
Policy Points
From the federal government’s latest trade report …
The U.S. Census Bureau and the U.S. Bureau of Economic Analysis, through the Department of Commerce, announced today that total February exports of $143.2 billion and imports of $182.9 billion resulted in a goods and services deficit of $39.7 billion, up from $37.0 billion in January, revised. February exports were $0.3 billion more than January exports of $142.9 billion. February imports were $3.0 billion more than January imports of $179.8 billion.
—
In February, the goods deficit increased $1.9 billion from January to $51.3 billion, and the services surplus decreased $0.8 billion to $11.6 billion. Exports of goods increased $0.1 billion to $98.5 billion, and imports of goods increased $2.0 billion to $149.8 billion. Exports of services increased $0.2 billion to $44.7 billion, and imports of services increased $1.0 billion to $33.1 billion.
—
In February, the goods and services deficit increased $13.2 billion from February 2009. Exports were up $17.9 billion, or 14.3 percent, and imports were up $31.1 billion, or 20.5 percent.
 One year ago, the four-week average for initial claims stood at 28,393 and the four-week average of continuing claims equaled 226,231.
 Email Sign-Up
 RSS Feed