Policy Points
29.10.2009
Policy Points
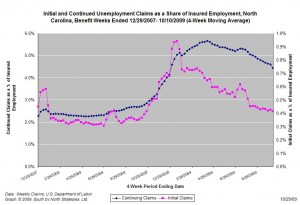
For the benefit week ending on October 10th, 15,852 North Carolinians filed initial claims for unemployment insurance, and 162,071 individuals applied for continuing insurance benefits. Compared to the prior week, there were fewer initial and continuing claims. These figures come from data released today by the U.S. Department of Labor.
Averaging new and continuing claims over a four-week period — a process that helps adjust for seasonal fluctuations and better illustrates trends — shows that an average of 16,491 initial claims were filed over the last four weeks, along with an average of 176,995 continuing claims. Compared to the previous four-week period, both initial and continuing claims were lower.

The graph shows the changes in unemployment insurance claims (as a share of covered employment) in North Carolina since the recession’s start in December 2007.
Although new and continuing claims appear to have peaked for this cycle, the claims levels remain elevated and point to a labor market that remains extremely weak.
29.10.2009
Policy Points
Using data compiled from an innovative survey program sponsored by the U.S. Department of Health and Human Services, the Center on Budget and Policy Priorities analyzed the cross-cutting economic challenges faced by poor and near-poor families. Reports the Center:
1.6 million poor households with children (more than one in three such households) experienced hunger in the four months preceding the survey, lived in severely crowded housing, or had their phone or utilities shut off in the previous 12 months. These households contained about 4 million poor children.
Counting near-poor families (below twice the federal poverty line), nearly 8 million low-income children lived in households that experienced hunger or severely crowded conditions or that had their phone or utilities shut off.
Half of poor families face multiple hardships each year: 52 percent faced two or more of 14 distinct hardships examined by HHS relating to basic needs and safe, adequate housing. Thirty-seven percent faced three or more distinct hardships. Only 7 percent of non-poor families with incomes above twice the poverty line faced three or more distinct hardships.
1.6 million poor households with children (more than one in three such households) experienced hunger in the four months preceding the survey, lived in severely crowded housing, or had their phone or utilities shut off in the previous 12 months. These households contained about 4 million poor children.
…
Counting near-poor families (below twice the federal poverty line), nearly 8 million low-income children lived in households that experienced hunger or severely crowded conditions or that had their phone or utilities shut off.
…
Half of poor families face multiple hardships each year: 52 percent faced two or more of 14 distinct hardships examined by HHS relating to basic needs and safe, adequate housing. Thirty-seven percent faced three or more distinct hardships. Only 7 percent of non-poor families with incomes above twice the poverty line faced three or more distinct hardships.
28.10.2009
Policy Points
Economic policy reports, blog postings, and media stories of interest:
28.10.2009
Policy Points
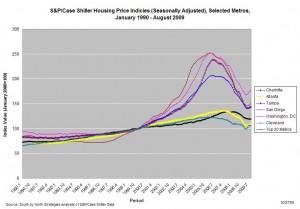
In August, the seasonally-adjusted home prices of single-family units rose in 16 of the 20 metro areas tracked by the S&P/Case-Shiller Housing Price Indicies. Despite those increases, sales price levels in all 20 markets remain significantly lower than they were one year ago.
 The graph (right) shows changes in price indices for selected metros. Data are shown for Charlotte, certain peer metros in the South Atlantic, and, for purposes of regional comparisons, San Diego and Cleveland. The composite measure for all 20 metros also is shown.
While Charlotte never experienced the same housing bubble seen in other metros, housing prices, as measured by the index, have fallen by 8.7 percent over the past year. And Charlotte was one of four metros tracked in the survey that recorded a month-to-month decline in prices.
Although most of the price tracked by the S&P.Case-Shiller Indicies have risen over the past few months, those trends don’t necessarily mean that the housing bubble has fully deflated. Explains Calculated Risk:
The debate continues – is the price increase because of the seasonal mix (distressed sales vs. non-distressed sales), the impact of the first-time home buyer frenzy on prices, less supply because of modifications and the general slowdown in the foreclosure process, or have prices actually bottomed? My guess is we will see further house price declines in many areas.
28.10.2009
Policy Points
New estimates prepared by the Tax Policy Center show just how few Americans are subject to the federal estate tax. Observes the center:
In 2009, less than one-quarter of one percent of deaths—just 5,500 decedents—will leave taxable estates, the smallest percentage since at least the Great Depression. In part, that tiny fraction reflects the current recession’s devastation of assets—the Fed estimates that the total value of household and nonprofit assets fell by about one-sixth between 2007 and the first quarter of 2009. But changes in estate tax rules over the past decade have played a much larger role than economic swings.


 Email Sign-Up
 RSS Feed