03.12.2012
Policy Points
Economic policy reports, blog postings, and media stories of interest:
03.12.2012
Policy Points
A major report in The New York Times traces how and why “the tax burden for most Americans is lower than in the 1980s.”
But in fact, most Americans in 2010 paid far less in total taxes — federal, state and local — than they would have paid 30 years ago. According to an analysis by The New York Times, the combination of all income taxes, sales taxes and property taxes took a smaller share of their income than it took from households with the same inflation-adjusted income in 1980.
…
Households earning more than $200,000 benefited from the largest percentage declines in total taxation as a share of income. Middle-income households benefited, too. More than 85 percent of households with earnings above $25,000 paid less in total taxes than comparable households in 1980.
…
Lower-income households, however, saved little or nothing. Many pay no federal income taxes, but they do pay a range of other levies, like federal payroll taxes, state sales taxes and local property taxes. Only about half of taxpaying households with incomes below $25,000 paid less in 2010.
03.12.2012
Policy Points
From the Federal Reserve Bank of Richmond’s latest survey of manufacturing activity in the South Atlantic (District of Columbia, Maryland, North Carolina, South Carolina, Virginia and West Virginia):
Manufacturing activity in the central Atlantic region advanced moderately in November following a slight pullback in October, according to the Richmond Fed’s latest survey. All broad indicators — shipments, new orders and employment — landed in positive territory. Other indicators were mixed, however. Capacity utilization was virtually unchanged, while backlogs fell further from its October reading. Moreover, the gauge for delivery times steadied, while finished goods inventories grew at a slightly quicker pace and growth in raw materials edged lower.
…
Looking ahead, assessments of business prospects for the next six months were more optimistic in November. Contacts at more firms anticipated that shipments, new orders, backlogs, vendor lead-times and capital expenditures will grow more quickly than anticipated a month ago.
30.11.2012
Policy Points
Mike Konczal wonders about “The Great Society’s Next Frontier.”
The 40-year conservative project to dismantle the welfare state has failed. Ronald Regan couldn’t reduce the size of the government (even his own), and the reactionary plans of George W. Bush and Paul Ryan to privatize Social Security and bleed out public health care have been rejected by voters. The slow-motion implosion of the conservative movement means that an abstract notion of a minimal state with no social insurance is not coming.
..
As [Prof. Lane] Kenworthy notes, people value insurance more as they grow richer. Insurance provides protection against both the unknown and bad luck. And the welfare state is how social insurance is provided in the United States. As such it will take on a larger, not a smaller, role as our country grows richer. With the promise of health care completing the project of the 20th-century welfare state, liberals need to envision how to meet the needs of a new century.
29.11.2012
Policy Points
For the benefit week ending on November 10, 2012, some 11,590 North Carolinians filed initial claims for state unemployment insurance benefits and 97,919 individuals applied for state-funded continuing benefits. Compared to the prior week, there were fewer initial and fewer continuing claims. These figures come from data released by the US Department of Labor.
Averaging new and continuing claims over a four-week period — a process that helps adjust for seasonal fluctuations and better illustrates trends — shows that an average of 12,131 initial claims were filed over the previous four weeks, along with an average of 96,989 continuing claims. Compared to the previous four-week period, the average number of initial claims was lower, as was the average number of continuing claims.
One year ago, the four-week average for initial claims stood at 12,100, and the four-week average of continuing claims equaled 106,650.
In recent months covered employment has increased and now exceeds the level recorded a year ago (3.8 million versus 3.7 million). Nevertheless, there are still fewer covered workers than there were in January 2008, which means that payrolls are smaller today than they were almost five years ago.
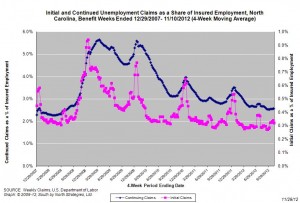
The graph shows the changes in unemployment insurance claims measured as a share of covered employment in North Carolina since the recession’s start in December 2007. 
Both new and continuing claims appear to have peaked for this cycle, and the four-week averages of new and continuing claims have fallen considerably. Yet continuing claims remain at an elevated level, which suggests that unemployed individuals are finding it difficult to find new positions.


 Email Sign-Up
 RSS Feed