Safety Nets At Work
Off the Charts notes that safety net programs that aren’t included in the calculation of official poverty figures lifted millions of Americans out of poverty in 2011.
Off the Charts notes that safety net programs that aren’t included in the calculation of official poverty figures lifted millions of Americans out of poverty in 2011.
Economic policy reports, blog postings, and media stories of interest:
For the benefit week ending on August 25, 2012, some 10,785 North Carolinians filed initial claims for state unemployment insurance benefits and 98,401 individuals applied for state-funded continuing benefits. Compared to the prior week, there were fewer initial and fewer continuing claims. These figures come from data released by the US Department of Labor.
Averaging new and continuing claims over a four-week period — a process that helps adjust for seasonal fluctuations and better illustrates trends — shows that an average of 11,307 initial claims were filed over the previous four weeks, along with an average of 100,277 continuing claims. Compared to the previous four-week period, the average number of initial claims was lower, as was the average number of continuing claims.
One year ago, the four-week average for initial claims stood at 10,594, and the four-week average of continuing claims equaled 107,383.
In recent weeks covered employment has increased and now exceeds the level recorded a year ago (3.77 million versus 3.72 million). Nevertheless, there are still fewer covered workers than there were in January 2008, which means that payrolls are smaller today than they were more than 4.5 years ago.
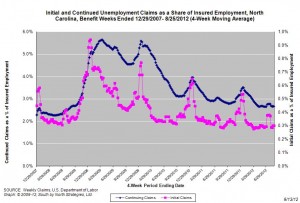
The graph shows the changes in unemployment insurance claims measured as a share of covered employment in North Carolina since the recession’s start in December 2007. 
Both new and continuing claims appear to have peaked for this cycle, and the four-week averages of new and continuing claims have fallen considerably. Yet continuing claims remain at an elevated level, which suggests that unemployed individuals are finding it difficult to find new positions.
The newest version of the Current Population Survey, a product of the U.S. Census Bureau, found that half of all American households earned more than$50,054 in 2011, half less than that amount. The graph below traces changes in real median household broken out by race from 1967 to 2011.
Economic policy reports, blog postings, and media stories of interest: