07.09.2012
Policy Points
From the 2012 edition of The State of Working North Carolina, published by the North Carolina Budget and Tax Center …
The outlook for workers worsened during the Great Recession and its aftermath. North Carolina ranked 6th in the nation for most jobs lost since the start of the Great Recession, and the unemployment rate is still nearly twice pre-recession levels. The lack of employment opportunities has increased economic hardship—North Carolina’s poverty rate reached 17.5 percent in 2010, the 12th highest in the nation, and North Carolina had the nation’s 12th lowest median household income.
…
These outcomes are a result of the economic conditions in North Carolina prior to the Great Recession, the severity of the recession’s impact on the state, and policymakers’ decisions to cut state investments in the tools that could rebuild the economy—an educated workforce, sound infrastructure and healthy communities.
06.09.2012
Policy Points
Economic policy reports, blog postings, and media stories of interest:
06.09.2012
Policy Points
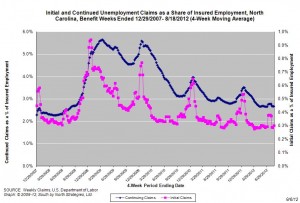
For the benefit week ending on August 18, 2012, some 12,351 North Carolinians filed initial claims for state unemployment insurance benefits and 100,887 individuals applied for state-funded continuing benefits. Compared to the prior week, there were more initial and fewer continuing claims. These figures come from data released by the U.S. Department of Labor.
Averaging new and continuing claims over a four-week period — a process that helps adjust for seasonal fluctuations and better illustrates trends — shows that an average of 11,323 initial claims were filed over the previous four weeks, along with an average of 100,762 continuing claims. Compared to the previous four-week period, the average number of initial claims was higher, as was the average number of continuing claims.
One year ago, the four-week average for initial claims stood at 10,654, and the four-week average of continuing claims equaled 108,206.
In recent weeks covered employment has increased and now exceeds the level recorded a year ago (3.77 million versus 3.72 million). Nevertheless, there are still fewer covered workers than there were in January 2008, which means that payrolls are smaller today than they were more than 4.5 years ago.
The graph shows the changes in unemployment insurance claims measured as a share of covered employment in North Carolina since the recession’s start in December 2007. 
Both new and continuing claims appear to have peaked for this cycle, and the four-week averages of new and continuing claims have fallen considerably. Yet continuing claims remain at an elevated level, which suggests that unemployed individuals are finding it difficult to find new positions.
06.09.2012
Policy Points
The Economic Policy Institute graphs the steady decline in unionization in the United States between 1973 and 2011.

05.09.2012
Policy Points
Economic policy reports, blog postings, and media stories of interest:


 Email Sign-Up
 RSS Feed