Job Openings In July 2013
From the Economic Policy Institute’s analysis of the July 2013 version of the Job Openings and Labor Turnover Survey (JOLTS) …
In July, the total number of job seekers, which declined by 263,000 from June, was 11.5 million (unemployment data are from the Current Population Survey and can be found here). The “job-seekers ratio”—the ratio of unemployed workers to job openings—slightly increased in July to 3.1-to-1. The ratio has been 3.0-to-1 or greater since October 2008, more than four-and-a-half years ago. A job-seekers ratio above 3-to-1 means there are no jobs for more than two out of three unemployed workers. To put today’s ratio of 3.1-to-1 in perspective, the highest the ratio ever got in the early 2000s downturn was 2.9-to-1 in September 2003. In a labor market with strong job opportunities, th
NC Unemployment Claims: Week Of 8/24/13
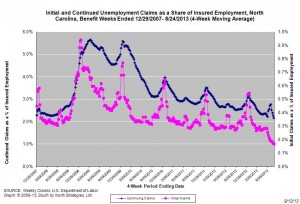
For the benefit week ending on August 24, 2013, some 6,043 North Carolinians filed initial claims for state unemployment insurance benefits and 78,847 individuals applied for state-funded continuing benefits. Compared to the prior week, there were fewer initial claims and fewer continuing claims. These figures come from data released by the US Department of Labor.
Averaging new and continuing claims over a four-week period — a process that helps adjust for seasonal fluctuations and better illustrates trends — shows that an average of 6,470 initial claims were filed over the previous four weeks, along with an average of 83,110 continuing claims. Compared to the previous four-week period, the average number of initial claims was lower, and the average number of continuing claims was lower.
One year ago, the four-week average for initial claims stood at 11,307, and the four-week average of continuing claims equaled 100,277.
In recent months covered employment has increased and now exceeds the level recorded a year ago (3.84 million versus 3.77 million). Nevertheless, there are still fewer covered workers than there were in January 2008, which means that payrolls are smaller today than they were more than 5.5 years ago.
The graph (right) shows the change s in unemployment insurance claims measured as a share of covered employment in North Carolina since the recession’s start in December 2007.
Both new and continuing claims appear to have peaked for this cycle, and the four-week averages of new and continuing claims have fallen considerably. In fact, the four-week average of initial claims, when measured as a share of covered employment, is now at the lowest level recorded since early 2008. The four-week average of continuing claims also has fallen to the lowest level recorded since early 2008.
Note that the recent declines in new and continuing claims are not necessarily indicative of an improving labor marker. State legislation that took effect on July 1, 2013, made major changes to insurance eligibility criteria, and the more stringent criteria eliminate claims that would have been valid prior to July 1. In time, this development also should reduce the number of continuing claims. Additionally, the legislation reduced the maximum number of weeks of state-funded insurance for which a claimant is eligible — an action that eventually should lead to a reduction in the number of continuing claims.
To place the numbers in context, consider how the four-week average of initial claims (6,470) was 42.8 percent lower than the figure recorded one year ago (11,370), while the average number of continuing claims was 17.2 percent lower (83,110 versus 100,277). Given the relative lack of improvement in labor market condition in North Carolina over the past year, such declines likely are products of changes to unemployment insurance laws rather than improvements in underlying economic conditions.
NC Unemployment Claims: Week Of 8/17/13
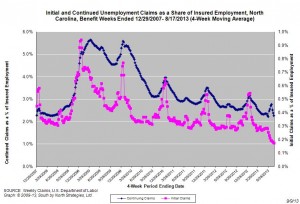
For the benefit week ending on August 17, 2013, some 6,209 North Carolinians filed initial claims for state unemployment insurance benefits and 81,461 individuals applied for state-funded continuing benefits. Compared to the prior week, there were fewer initial claims and fewer continuing claims. These figures come from data released by the US Department of Labor.
Averaging new and continuing claims over a four-week period — a process that helps adjust for seasonal fluctuations and better illustrates trends — shows that an average of 6,699 initial claims were filed over the previous four weeks, along with an average of 87,059 continuing claims. Compared to the previous four-week period, the average number of initial claims was lower, and the average number of continuing claims was lower.
One year ago, the four-week average for initial claims stood at 11,323, and the four-week average of continuing claims equaled 100,762.
In recent months covered employment has increased and now exceeds the level recorded a year ago (3.84 million versus 3.77 million). Nevertheless, there are still fewer covered workers than there were in January 2008, which means that payrolls are smaller today than they were more than 5.5 years ago.
The graph (right) shows the change s in unemployment insurance claims measured as a share of covered employment in North Carolina since the recession’s start in December 2007.
Both new and continuing claims appear to have peaked for this cycle, and the four-week averages of new and continuing claims have fallen considerably. In fact, the four-week average of initial claims, when measured as a share of covered employment, is now at the lowest level recorded since early 2008. Yet continuing claims remain at an elevated level, which suggests that unemployed individuals are finding it difficult to find new positions.
NC Unemployment Claims: Week Of 8/17/13
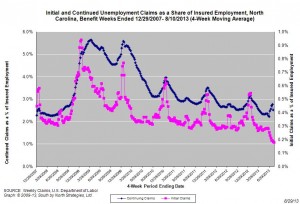
For the benefit week ending on August 10, 2013, some 6,306 North Carolinians filed initial claims for state unemployment insurance benefits and 82,266 individuals applied for state-funded continuing benefits. Compared to the prior week, there were fewer initial claims and fewer continuing claims. These figures come from data released by the US Department of Labor.
Averaging new and continuing claims over a four-week period — a process that helps adjust for seasonal fluctuations and better illustrates trends — shows that an average of 6,870 initial claims were filed over the previous four weeks, along with an average of 91,443 continuing claims. Compared to the previous four-week period, the average number of initial claims was lower, and the average number of continuing claims was lower.
One year ago, the four-week average for initial claims stood at 10,787, and the four-week average of continuing claims equaled 100,636.
In recent months covered employment has increased and now exceeds the level recorded a year ago (3.84 million versus 3.77 million). Nevertheless, there are still fewer covered workers than there were in January 2008, which means that payrolls are smaller today than they were more than 5.5 years ago.
The graph (right) shows the change s in unemployment insurance claims measured as a share of covered employment in North Carolina since the recession’s start in December 2007.
Both new and continuing claims appear to have peaked for this cycle, and the four-week averages of new and continuing claims have fallen considerably. In fact, the four-week average of initial claims, when measured as a share of covered employment, is now at the lowest level recorded since early 2008. Yet continuing claims remain at an elevated level, which suggests that unemployed individuals are finding it difficult to find new positions.
Local Unemployment Rates Down Again In July
CHAPEL HILL, NC (August 28, 2013) – Between July 2012 and July 2013, unemployment rates fell in 97 of North Carolina’s 100 counties and in all of the state’s 14 metropolitan areas. Over that same period, the size of the labor force decreased in 70 counties and in 7 metro areas. These findings come from new estimates released by the Labor and Economic Analysis Division of the North Carolina Department of Commerce.
“Local unemployment rates throughout North Carolina have fallen over the course of 2013,” said John Quinterno, a principal with South by North Strategies, Ltd., a research firm specializing in economic and social policy. “Unemployment rates nevertheless remain elevated, with 38 counties and 3 metro areas posting unemployment rates of at least 10 percent. In July 2008, in contrast, three counties and no metro areas logged unemployment rates of at least 10 percent.”
Compared to December 2007, which is when the national economy fell into recession, North Carolina now has 2.7 percent fewer jobs (-114,400) and has seen its unadjusted unemployment rate climb to 9.1 percent from 4.7 percent. In July, the state gained 8,200 more jobs than it lost (+0.2 percent). Since bottoming out in February 2010, the state’s labor market has netted some 5,205 jobs per month, resulting in a cumulative gain of 213,400 positions (+5.6 percent).
Between June 2013 and July 2013, local unemployment rates decreased in 81 of the state’s 100 counties, rose in nine counties, and held steady in 10 counties. Individual county rates ranged from 5.3 percent in Currituck County to 16 percent in Scotland County. Overall, 38 counties posted unemployment rates greater than or equal to 10 percent, and 55 counties posted rates between 7 and 9.9 percent.
“Non-metropolitan labor markets continue to struggle relative to metropolitan ones,” noted Quinterno. “In July, 10 percent of the non-metro labor force was unemployed, compared to 8.7 percent of the metro labor force. Compared to December 2007, the non-metro labor force now has 4.7 percent fewer employed persons, while the number of unemployed individuals is 81.2 percent larger.”
Over the month, unemployment rates fell in 12 metro areas, rose in one, and held steady in one. Rocky Mount had the highest unemployment rate (13.3 percent), followed by Fayetteville (10.6 percent) and Hickory-Morganton-Lenoir (10 percent). Asheville had the lowest unemployment rate (6.8 percent), followed by Durham-Chapel Hill (7.1 percent) and Raleigh-Cary (7.3 percent).
Compared to July 2012, unemployment rates in July 2013 were lower in 97 counties and 14 metro areas. Over the year, however, labor force sizes decreased in 70 counties and in 7 metros. Among metros, Hickory-Morganton-Lenoir’s labor force contracted at the greatest rate (-1.6 percent), followed by Rocky Mount (-1.1 percent). With those changes, metro areas now are home to 71.7 percent of the state’s labor force, with 50.3 percent of the labor force residing in the Triangle, Triad, and Charlotte metros.
In the long term, improvements in overall labor market conditions depend on growth in the Charlotte, Research Triangle, and Piedmont Triad regions. Yet growth in these metros remains muted. Collectively, employment in those three metro regions has risen by 3.3 percent since December 2007, and the combined July unemployment rate in the three regions equaled 8.5 percent. That was down from the 9.4 percent rate recorded one year ago yet was well above the 6.2 percent rate recorded in July 2008. Of the three broad regions, the Research Triangle had the lowest July unemployment rate (7.5 percent), followed by Charlotte and the Piedmont Triad (both 9.2 percent).
“Approximately 3.5 years into a recovery in North Carolina’s labor market, unemployment rates remain extremely elevated across the state,” said Quinterno. “The first half of 2013 was the most disappointing one for job growth since the onset of the recovery, and 2013 currently is shaping up to be the worst year for labor markets in North Carolina since the onset of the recovery.”


 Email Sign-Up
 RSS Feed